It is installed on a virtual machine and should monitor my Switches and AP’s, that are Ubiquiti EdgeMax devices, but also everything else on the network for Uptime. All other devices on all networks, Green, Blue and eventually others I may create. And it should also have access to Internet.
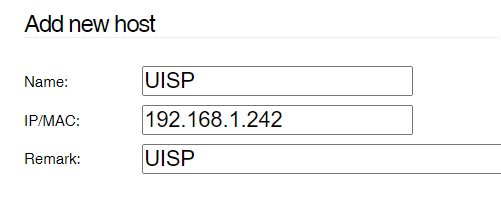
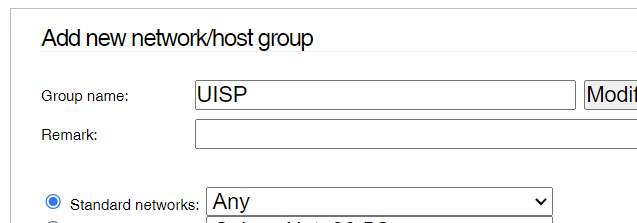
I have been fiddling with a firewall rule to accomplish his, but failed so far. It seems to me I should create a group with this UISP server, select that group and add all networks to it…
My attempts seem logical - to me -but do not work. The UISP server instance can still not access devices on Blue, it can see them, but not access them. (Current IP, 192.168.1.242, is only while testing)
looks like your firewall rule is backward.
Source blue (192.168.10.2)
Destination green (192.168.1.242)
the default firewall no traffic from blue to green
See this
The server is on Green, I want it to access Blue.
Would the Green server IP not be the Source in that case?
@arne_f that is kinda what I am trying to do, but it will never show up on Blue unless I create a FW rule for it to be able access Blue since it is a different network range.
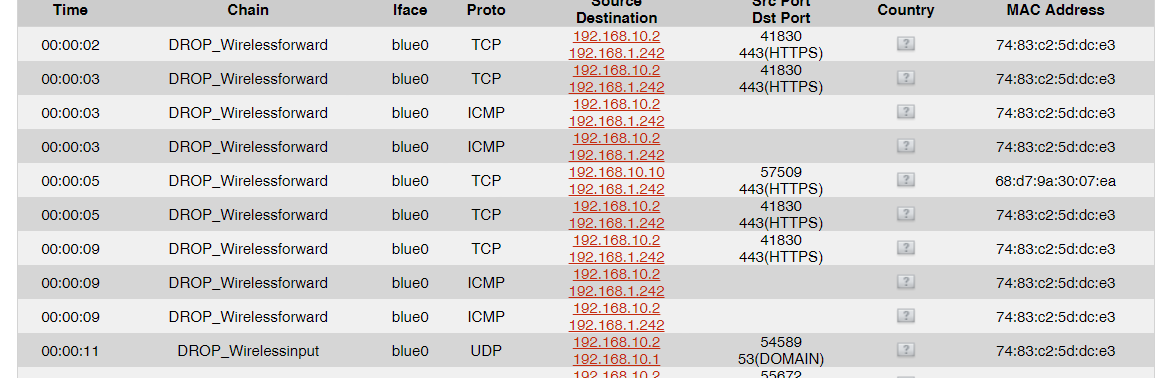
The packets from 192.168.10.2 and 192.168.10.10 are dropped because they are not allowed to use the blue network at all. This is the reason for the log entries from your screenshot.
Just in case, can you disable mac address filtering and test again if you get the same error? I had in the past a couple of situation where this filtering would behave strangely and the problem would disappear when I disabled the mac filtering. I never reported it because I could not clearly understand at the time what happened and I did not take notes.
I may be wrong, but I do not see how that error is relevant to my question in the first post.
I only posted that screenshot to elucidate some entries I found in that log, while not being sure where my attempts to get one device to access the entire network would be logged. The one in Host Group.
So I need a fw pinhole for the blue to get data to the green monitoring server.
Or, a fw pinhole for the green monitoring server to get data from blue devices.
What is the difference… in one scenario blue is the source, in the other the green server is the source?
I though that is what I was trying to accomplish, either one of those.
in any case I realized I need a MAC and a Lease on Green for the monitoring server, it seems the Docker Networking is kinda hinding that from the rest of the network, despite the sUISP being able to access green devices…
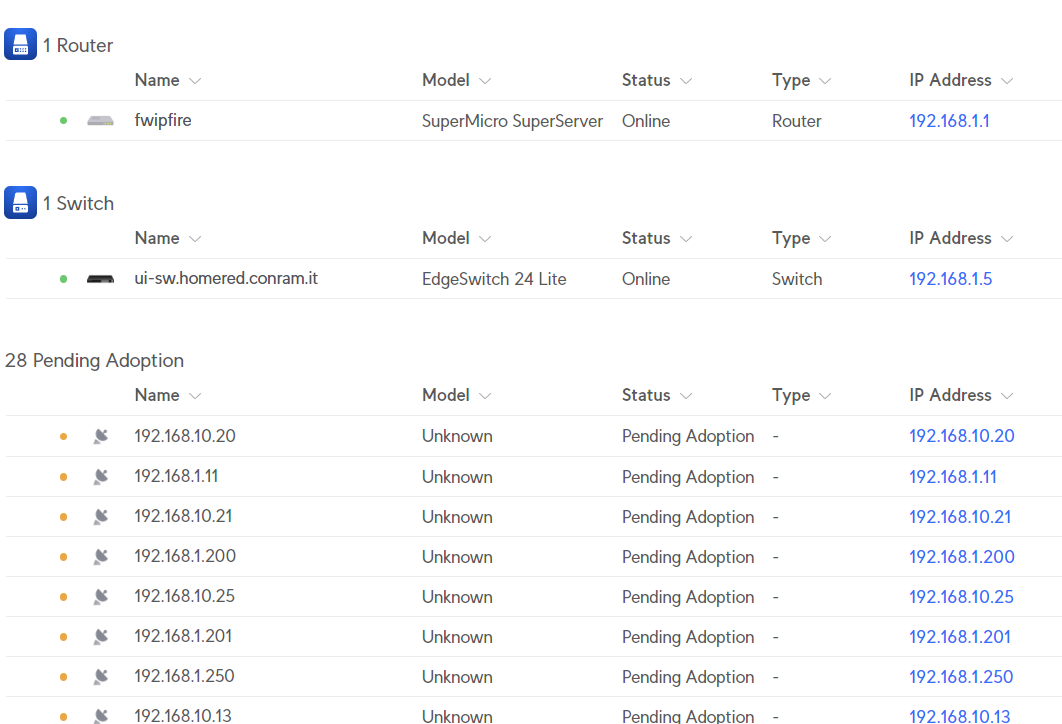
When looking at below image remember 192.168.1.1/24 is Green, 192.168.10.1/24 is Blue.
I am removing this from the Docker environment and setting it up as a new virtual instance which will allow me to specify a MAC and fixed IP address. Should make things a little easier I hope
What is the difference… in one scenario blue is the source, in the other the green server is the source?
The default firewall will not let blue talk to green.
Green can talk to blue no pinhole needed for
Comunication in that direction.
Example I have a jellyfin server on a server in green. Devices in Blue need a pinhole to talk to the jellyfin server.
On the subject of docker.
My server is running jellyfin in a docker.
My server has no firewall of its own.
So I don’t need to open ports there.
They are all open.
So as mentioned above. Please check the Blue access. Mac filter on blue.
Put laptop on blue and make sure you can search the internet. If you can not. Check the blue access. The wiki posted above will guide you in how to disable.
The device in blue is not on the list that can use the blue network at all.
The server in green not need a firewall rule to access devices on blue but the devices in blue must be on the blue access list to be able to answer the incomming connection.
Tried from blue to green and from green to blue and both at the same time… one is getting blocked by policy and I am still not certain where the firewall is logging that.
What I changed yesterday was putting the UISP on its own machine with an allocated fixed IP (192.168.1.13) linked with MAC address. I have also added the Green IP 192.168.1.13 with corresponding MAC to the Blue Mac filtering list, which makes zero sense to me, but there goes…
@hvacguy I don’t have anything that should block on my Docker either… that I am aware of. I need port 443 to work, if any port is to be specified, but allowing all is fine.
And I see multiple MAC addresses for the UISP server.
root@xservu2:~# ip link
1: lo: <LOOPBACK,UP,LOWER_UP> mtu 65536 qdisc noqueue state UNKNOWN mode DEFAULT group default qlen 1000
    link/loopback 00:00:00:00:00:00 brd 00:00:00:00:00:00
2: eth0: <BROADCAST,MULTICAST,UP,LOWER_UP> mtu 1500 qdisc mq state UP mode DEFAULT group default qlen 1000
    link/ether 00:15:5d:55:13:07 brd ff:ff:ff:ff:ff:ff
3: br-26027a143aa9: <BROADCAST,MULTICAST,UP,LOWER_UP> mtu 1500 qdisc noqueue state UP mode DEFAULT group default
    link/ether 02:42:3b:61:85:0a brd ff:ff:ff:ff:ff:ff
4: br-9768322ea732: <BROADCAST,MULTICAST,UP,LOWER_UP> mtu 1500 qdisc noqueue state UP mode DEFAULT group default
    link/ether 02:42:15:10:01:21 brd ff:ff:ff:ff:ff:ff
5: docker0: <NO-CARRIER,BROADCAST,MULTICAST,UP> mtu 1500 qdisc noqueue state DOWN mode DEFAULT group default
    link/ether 02:42:f1:60:4f:ff brd ff:ff:ff:ff:ff:ff
This is from a root terminal on the Ubuntu host.
1 is obviously not relevant, and 2 should be the one to use, but it could also be 5, but hat is not UP.