Isn’t there a historical log, preferably a graphic one, for WAN larency and performance?
I need to show the status of WAN to ISP technicians in the last week/month.
Thanks in advance
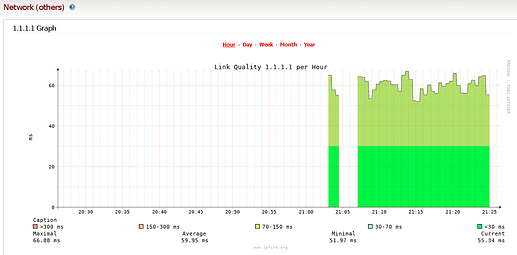
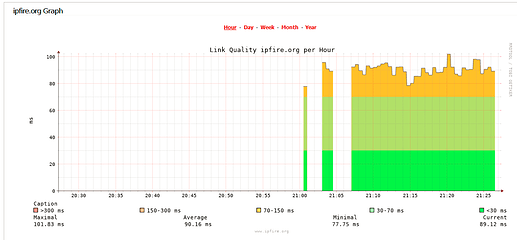
The gateway graph in Status > Network (other) pings the gateway of the ISP and collects data. The graph provides hour, day, week, month, year. Does this help?
Of course, I had looked at the wrong panel.
Thanks.
You can also ping other hosts this way.
Then in the /etc/collectd.custom file add similar entries as below
<Plugin ping>
	Host "ipfire.org"
	interval 30
	timeout 10
</Plugin>

<Plugin ping>
	Host "1.1.1.1"
	interval 30
	timeout 10
</Plugin>
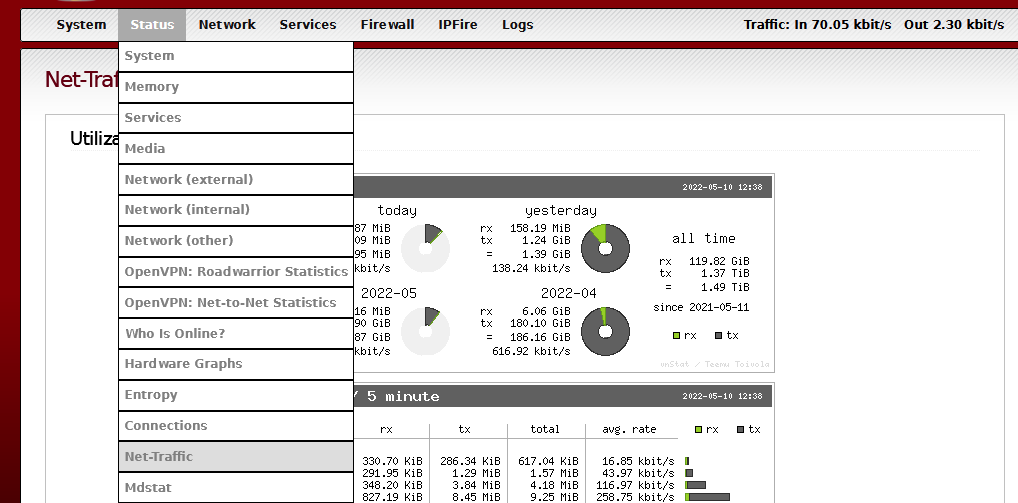
how do i know how many MB to download or upload per hour?
The ISP is telling me that it blocks my line for excessive traffic in an hour.
I think that’s a question for a separate topic.
You can go to
WUI-->System--> GUI Settings and check Show Ajax speedmeter
or
WUI --> Status--> Network (external)
or
WUI-->Status-->Net-Traffic
edit:
or use a console tool like iftool , iptraf-nf
edi2:
also the below link may be of interest to you
Thanks a lot for your help


