Hello, I have a big monitor and want to see more of the IPFire graph details.
My method of increasing the graph size requires two changes and some experimentation.
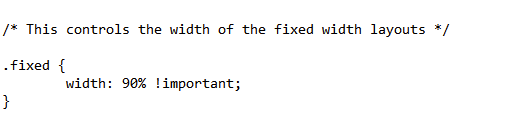
First of all the over all width of the IPFire web site needs to be enlarged to accomodate the larger graphs:
Edit the file:
/srv/web/ipfire/html/themes/ipfire/include/css/style.css
Edit the width near the top, 90% works for me (Note this affects all the IPFire Web UI)
Hi,
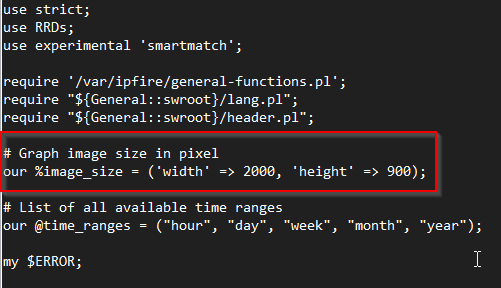
That’s exactly how I would have approached that task %image_size is used troughout the internal graph system. Only some addons (e.g. WIO) create their own graphs and won’t be changed.
I am not very familiar with the RRD system. Is there any more data available in the database that can be displayed this way? Or does it just increase the image size?
Unfortunately the IPFire CSS is not really meant to be responsive. Many CGI pages print forms and tables with fixed widths, which would interfere with a responsive theme.
I guess this is a subtle hint that I should look into modernising that
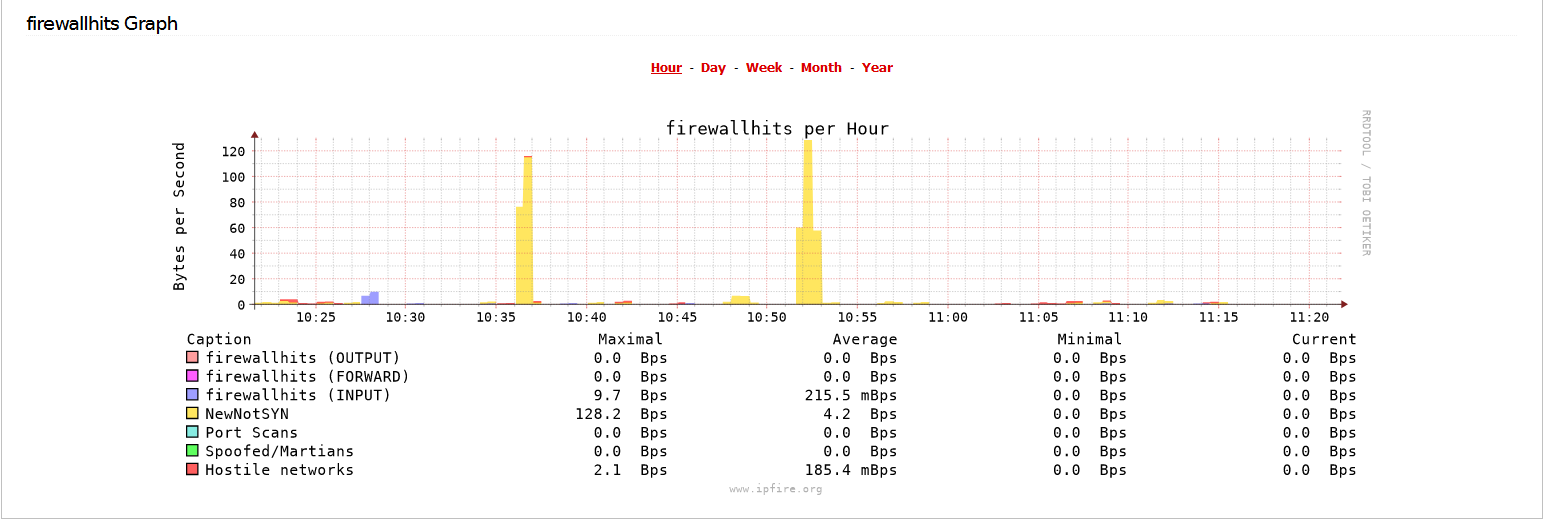
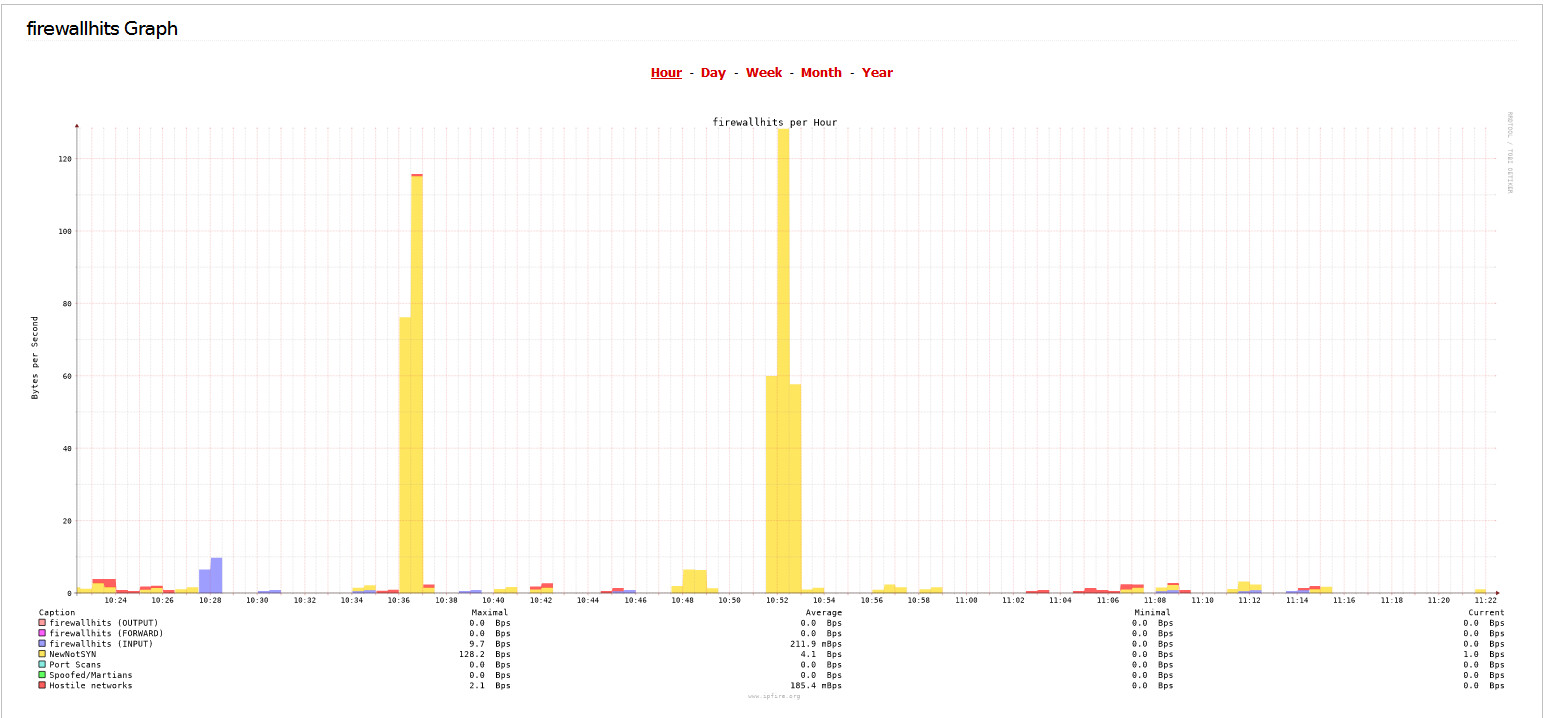
It is clear, that you can see more details.
Data is represented by vertical lines stacked one category above the other.
The scale is chosen such, that the maximal value matched approximately the height of the graph. The pixel size is fixed. If the height of the graph increases, the height of the single parts increases also. So different small parts are more distinguishable.