At the bottom of the page, you could select only few of them and save. You can rotate among them. Otherwise I think you need to play with RDD tool with your own scripts.
You also could post a request to the devs.
Good place would be bugzilla.ipfire.org.
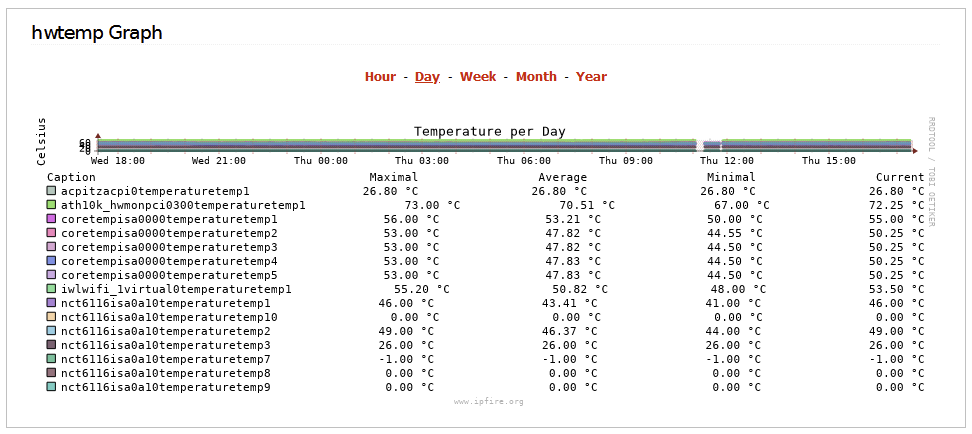
The problem is that the size of the graph frame isn’t big enough for so many legend lines. RRDTool writes all description lines. The space remaining is used for the graph itself.
This could be solved by a split of the graph into several graphs or by a dynamic frame size.
I don’t think that it is changed in 5 years.
My experience is, that also those ‘cosmetic’ corrections find a willing developper. An example is the integration of help links to the wiki. Nothing necessary, but implemented supported by an engaged discussion in the devel mailing list.
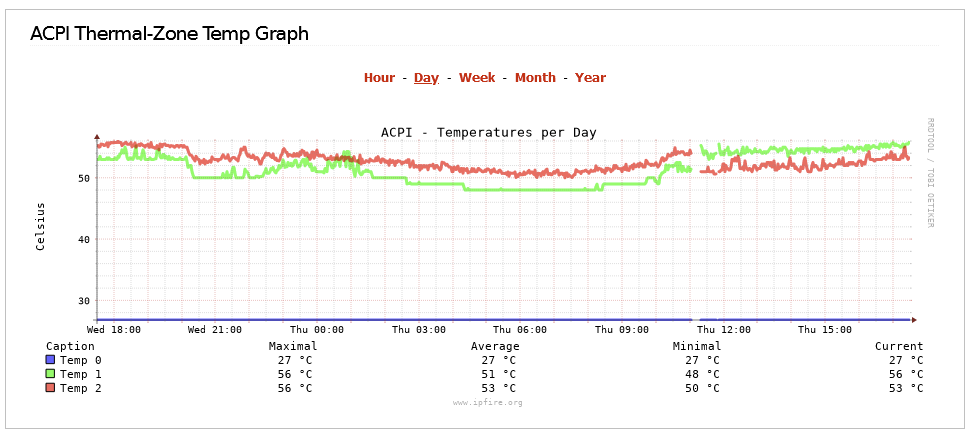
I noticed that colors change sometime, but no color swaps between the sensors.
I’m running a Duo Box which has a similar problem: the hardware graphs show a lot of rather useless temperature readings coming from an ‘nct6106’ sensor. E.g., temperature reads are -128 °C or 0 °C. Nothing I need or want to see as graphs.
Workaround:
Stop ‘collectd’: /etc/init.d/collectd stop
Delete - in my case - the directory /var/log/rrd/collectd/localhost/sensors-nct6106-isa-0a10
Edit /etc/sysconfig/lm_sensors and change the line
HWMON_MODULES="coretemp nct6775"
to
HWMON_MODULES="coretemp"
Unload nct6775:
modprobe -r nct6775
Start ‘collectd’: /etc/init.d/collectd start
I tried to blacklist this module by adding the line blacklist nct6775 in /etc/modprobe.d/blacklist.conf, but this didn’t work.