gw-ipfire
13 July 2022 10:25
1
hi
Requests with error response codes
    401 Unauthorized
       /cgi-bin/index.cgi: 3 Time(s)
       /graphs/vnstat-5-green0.png: 1 Time(s)
       /graphs/vnstat-d-green0.png: 1 Time(s)
       /graphs/vnstat-h-green0.png: 1 Time(s)
       /graphs/vnstat-m-green0.png: 1 Time(s)
       /graphs/vnstat-s-green0.png: 1 Time(s)
       /graphs/vnstat-t-green0.png: 1 Time(s)
in kernel
WARNING:  Segmentation Faults in these executables
    libxml2.so.2.9. :  1
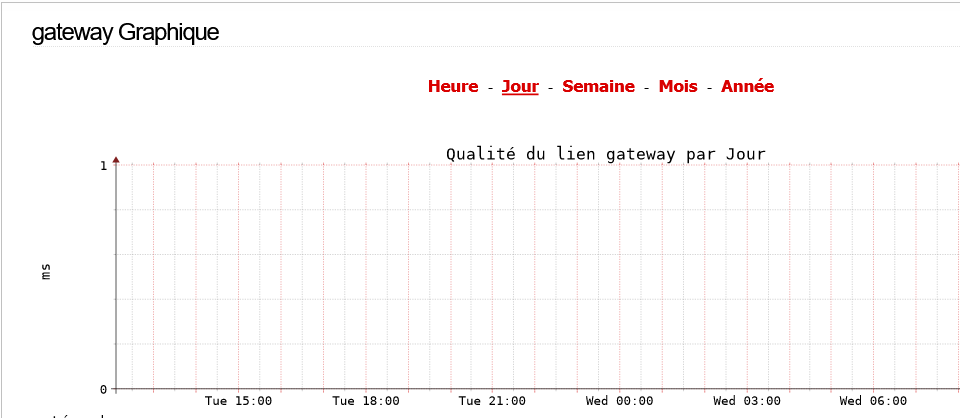
in graph gateway
no graph
ty
pmueller
13 July 2022 10:54
2
Hi,
thank you for reporting back.
However, aside from the empty gateway latency graph, these errors can all be safely ignored. During the update, major parts of the web interface are being changed, so it is normal to see some glitches being logged, since things like the speed display snippet will continue to generate HTTP requests during the upgrade.
libxml2 has been updated as well, as mentioned in the changelog . If any process still running against the old version tries to conduct some XML parsing by chance, that will fail - with the log message you noted.
After a reboot, such log messages should not happen anymore. If they do, please let us know.
Does the empty gateway graph persist after a reboot as well?
Thanks, and best regards,
gw-ipfire
13 July 2022 11:28
3
ty
pmueller
13 July 2022 19:06
4
Hi,
just for the records, an ordinary reboot is completely sufficient after an upgrade. There is no need for a forced file system check.
I assume the graph worked before. If so, please answer the following questions:
From which Core Update were you upgrading?
Are there any correspondent log messages in the firewall logs (they include DROP_OUTPUT)?
What is the gateway to your IPFire? An upstream router, your ISP, … ?
What is the output of ping -c 5 gateway on your IPFire machine?
Thanks, and best regards,
2 Likes
gw-ipfire
13 July 2022 19:59
5
hi
From which Core Update were you upgrading?
168
Are there any correspondent log messages in the firewall logs (they include DROP_OUTPUT)?
no
What is the gateway to your IPFire? An upstream router, your ISP, … ?
ISP router bridge mode
What is the output of ping -c 5 gateway on your IPFire machine?
ping -c 5 gateway
# ping -c 5 gateway
PING gateway (x.x.x.x) 56(84) bytes of data.

--- gateway ping statistics ---
5 packets transmitted, 0 received, 100% packet loss, time 4100ms
ty
pmueller
13 July 2022 20:03
6
Hi,
ipfire-test ipfire-test:
What is the output of ping -c 5 gateway on your IPFire machine?
ping -c 5 gateway
# ping -c 5 gateway
PING gateway (x.x.x.x) 56(84) bytes of data.

--- gateway ping statistics ---
5 packets transmitted, 0 received, 100% packet loss, time 4100ms
well, for some reason, your gateway does not respond to pings (anymore). Therefore, the graph cannot show anything since there is no data to display.
Thanks, and best regards,
2 Likes
gw-ipfire
13 July 2022 20:07
7
hi
gw-ipfire
13 July 2022 20:25
8
hi
gw-ipfire
14 July 2022 15:26
9
hi
Peter Müller:
libxml2 has been updated as well, as mentioned in the changelog . If any process still running against the old version tries to conduct some XML parsing by chance, that will fail - with the log message you noted.
After a reboot, such log messages should not happen anymore. If they do, please let us know.
for the logs is ok no error
tphz
15 July 2022 18:42
10
In my one case, the ISP gateway is also not responding to pings.
You can also ping other hosts this way.
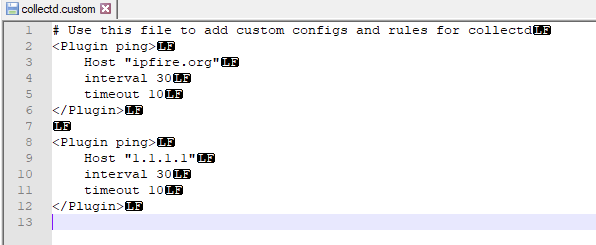
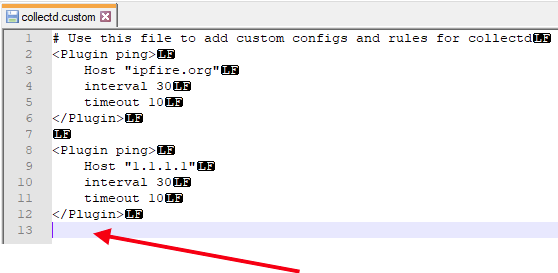
Then in the /etc/collectd.custom file add similar entries as below
<Plugin ping>
Host "ipfire.org"
interval 30
timeout 10
</Plugin>
<Plugin ping>
Host "1.1.1.1"
interval 30
timeout 10
</Plugin>
[obraz]
[obraz]
Regards
1 Like
gw-ipfire
16 July 2022 13:51
11
hi
tphz
16 July 2022 17:08
12
Don’t give up
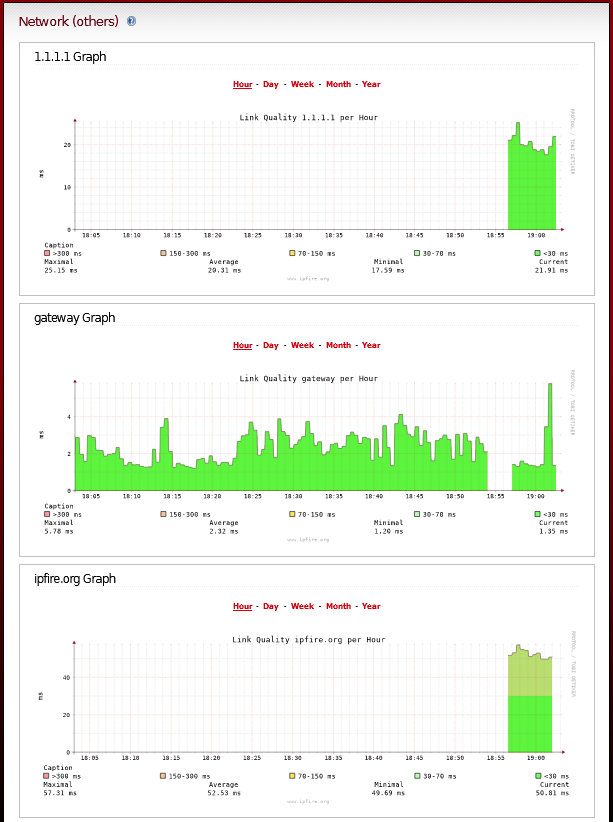
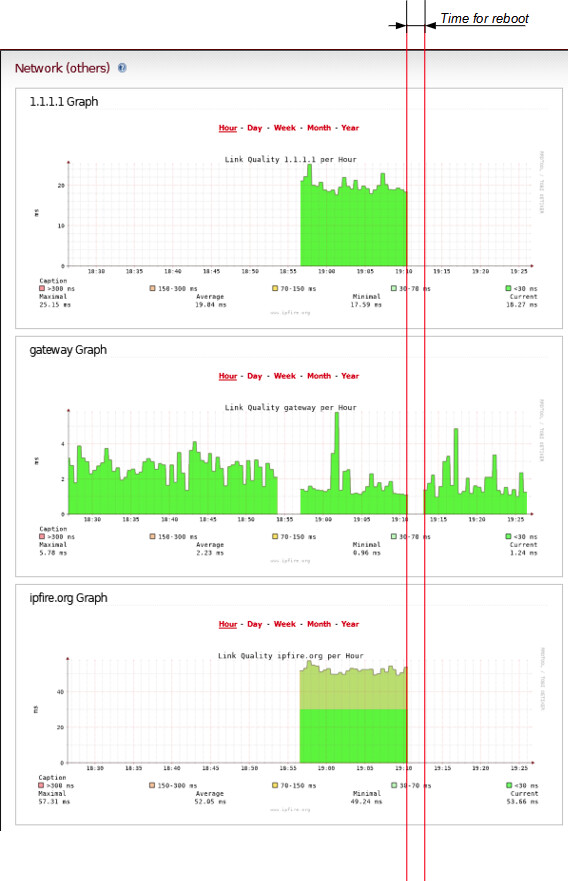
I did a test on the VM./etc/collectd.custom file and rebooted the VM.
The result, after entering into the /etc/collectd.custom file, rebooting and waiting a few minutes
Note that the interval is 30 seconds.
edit:
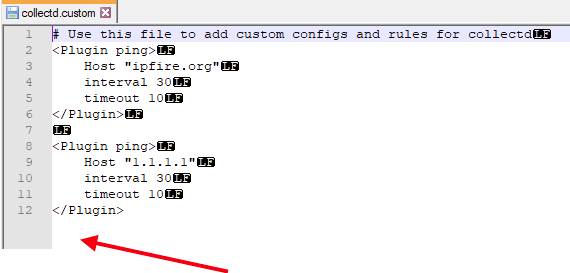
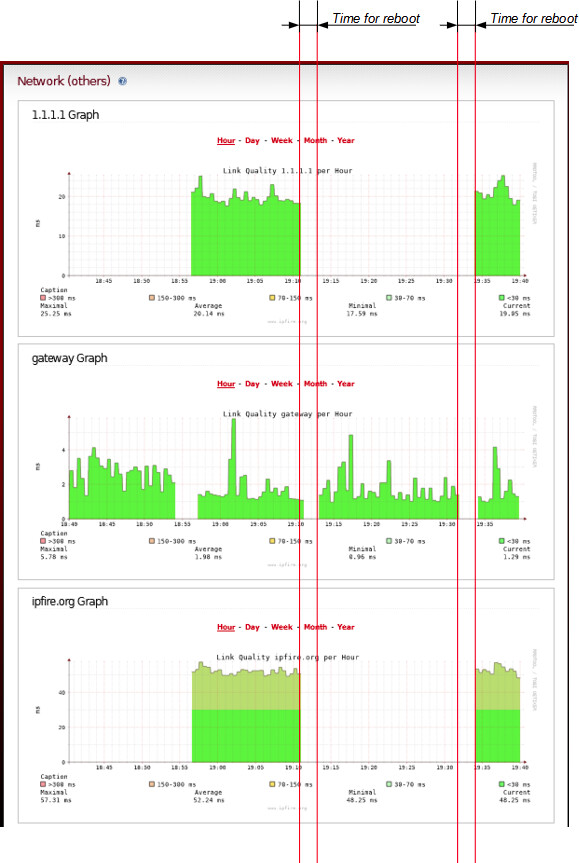
Next test./etc/collectd.custom file as follows and restarted the VM.
Below is the effect after rebooting and waiting a few minutes.
edit2:
Tested on Core Update 169 Development Build
Regards.
1 Like
gw-ipfire
17 July 2022 16:26
13
hi
1 Like