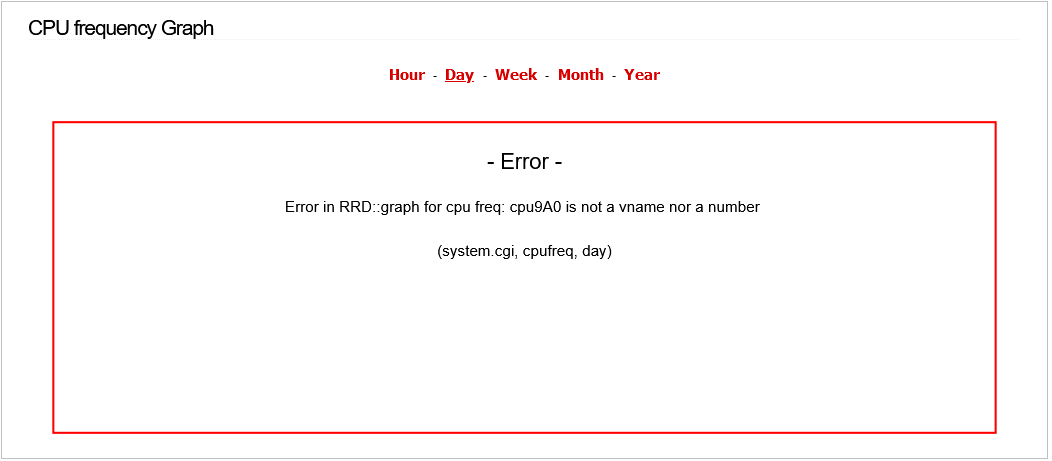
Ok so i had some time to play with this again and ive found that if you modify line 1104 in graphs.pl
,"LINE1:cpu".$i.$color{"color1$j"}."A0:cpu ".$i." "
to
,"LINE1:cpu".$i.$color{"color$j"}."A0:cpu ".$i." "
colors.txt starts at 1 and goes through 25 so if you have color1$j then your starting at 10 i believe.
with the change you willl no longer get the dreaded “cpu9A0 is not a vname nor a number msg”
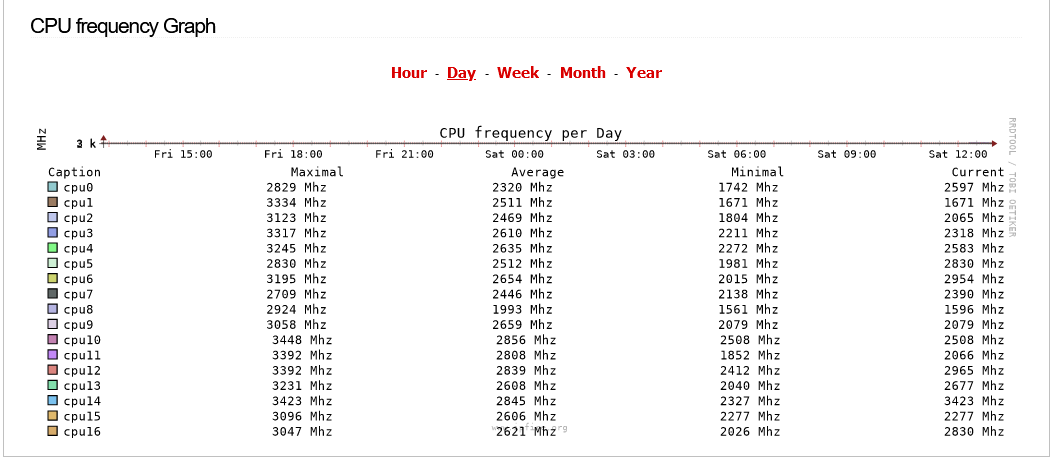
also for people with more then 8 cores you can change line 1083
@GRAPH_ARGS,
to
	"--imgformat", "SVG",
	# No border
	"--border", "0",
	# For a more 'organic' look
	"--slope-mode",
	# HxW define the size of the output image
	"--full-size-mode",
	# Watermark
	"-W www.ipfire.org",
	# Default size
	"-w 910",
	"-h 600",
	# Use alternative grid
	"--alt-y-grid",
so the graph for only that metric will be resized and show the graph also
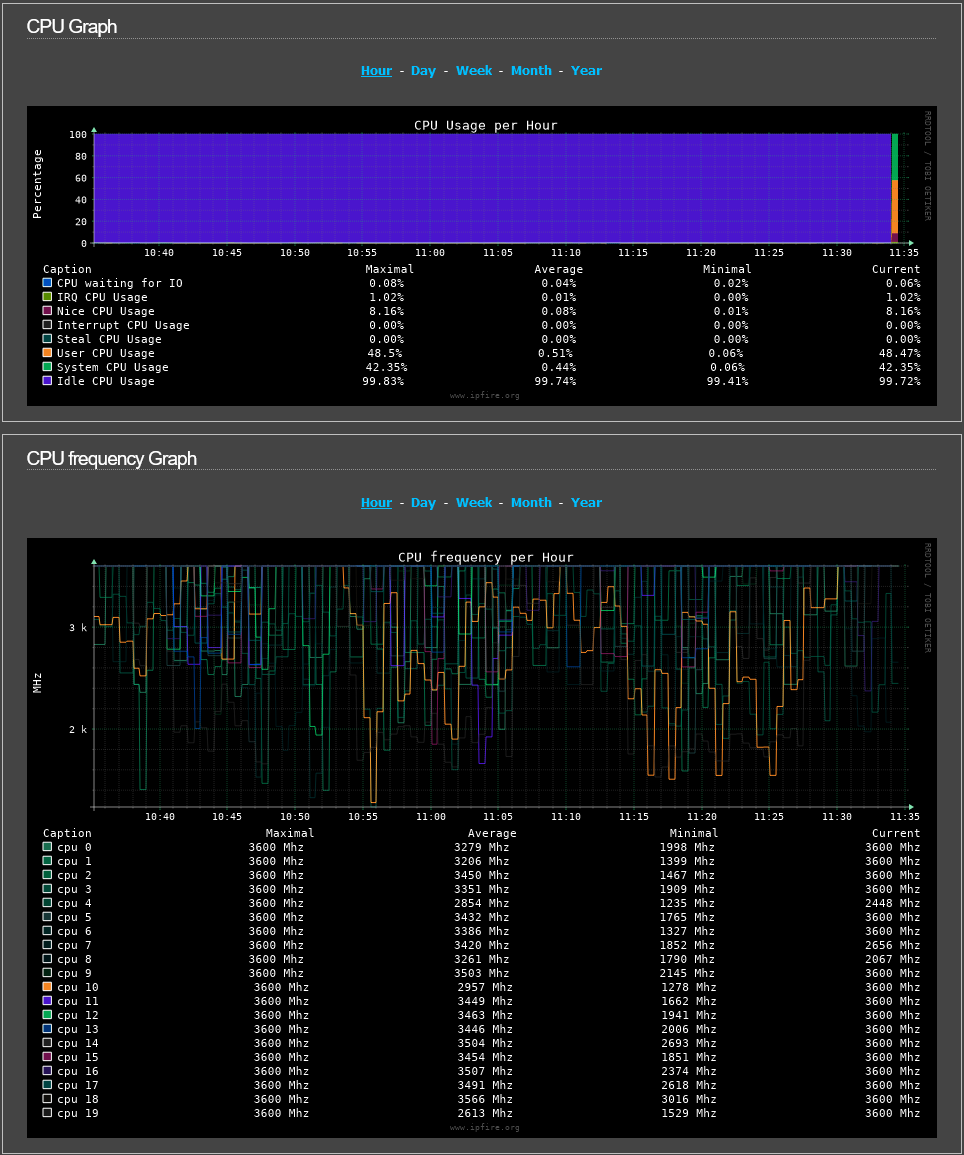
the entirety of that section of code is
sub updatecpufreqgraph {
	my $cpucount = `ls -dA $mainsettings{'RRDLOG'}/collectd/localhost/cpu-*/ 2>/dev/null | wc -l`;
	my $period    = $_[0];
	my @command = (
	"--imgformat", "SVG",
	# No border
	"--border", "0",
	# For a more 'organic' look
	"--slope-mode",
	# HxW define the size of the output image
	"--full-size-mode",
	# Watermark
	"-W www.ipfire.org",
	# Default size
	"-w 910",
	"-h 600",
	# Use alternative grid
	"--alt-y-grid",
		"-",
		"--start",
		"-1".$period,
		"-r",
		"-t ".$Lang::tr{'cpu frequency per'}." ".$Lang::tr{$period."-graph"},
		"-v MHz",
		"--color=SHADEA".$color{"color19"},
		"--color=SHADEB".$color{"color19"},
		"--color=BACK".$color{"color21"},
		"COMMENT:".sprintf("%-10s",$Lang::tr{'caption'}),
		"COMMENT:".sprintf("%15s",$Lang::tr{'maximal'}),
		"COMMENT:".sprintf("%15s",$Lang::tr{'average'}),
		"COMMENT:".sprintf("%15s",$Lang::tr{'minimal'}),
		"COMMENT:".sprintf("%15s",$Lang::tr{'current'})."\\j"
	);

	for(my $i = 0; $i < $cpucount; $i++) {
		my $j=$i+1;
		push(@command,"DEF:cpu".$i."_=".$mainsettings{'RRDLOG'}."/collectd/localhost/cpufreq/cpufreq-".$i.".rrd:value:AVERAGE"
				,"CDEF:cpu".$i."=cpu".$i."_,1000000,/"
				,"LINE1:cpu".$i.$color{"color$j"}."A0:cpu ".$i." "
				,"GPRINT:cpu".$i.":MAX:%3.0lf Mhz"
				,"GPRINT:cpu".$i.":AVERAGE:%3.0lf Mhz"
				,"GPRINT:cpu".$i.":MIN:%3.0lf Mhz"
				,"GPRINT:cpu".$i.":LAST:%3.0lf Mhz\\j");
	}

	RRDs::graph (@command);
	$ERROR = RRDs::error;
	return "Error in RRD::graph for cpu freq: ".$ERROR."\n" if $ERROR;
}
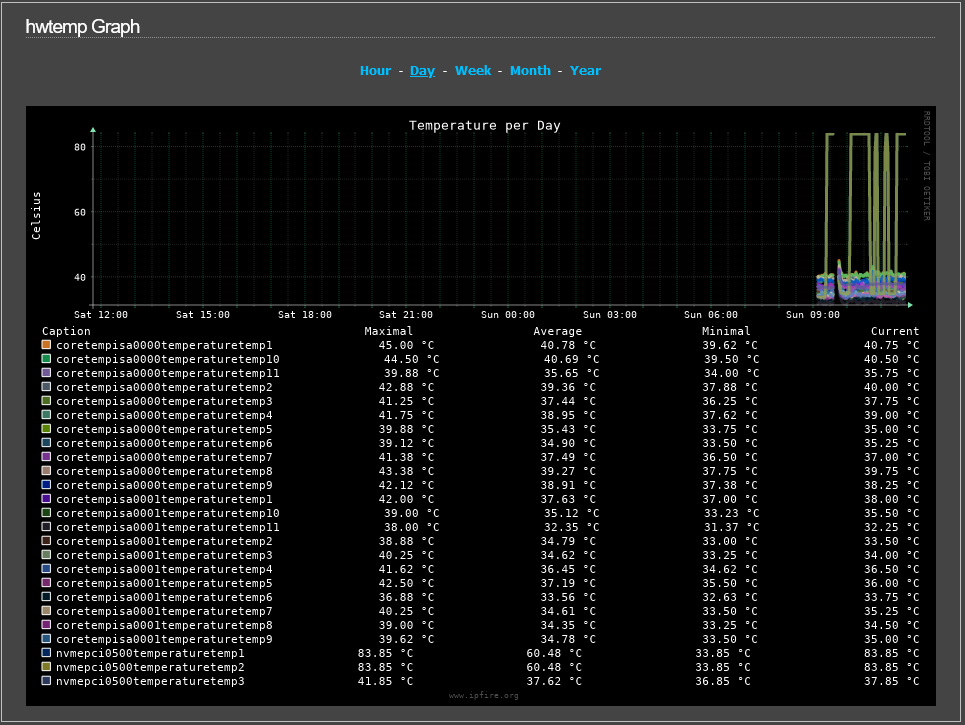
This sizing edit will also work for the HWTempgraph on line 859
I haven’t found a way as of yet to auto-size the graphs per the data they need to show, but for now this works