I created a set of Zabbix templates to monitor IPFire general stats (Available entropy, state of RNG), services (default IPFire services and possible Addon services), Network stats (Line quality, Open Connections, Firewall hits) and also integrated @starkstromkonsument’s Pakfire template.
For the service states/information I created a Perl script for use by the Zabbix agent, based on the code found in the IPFire webUI services.cgi.
The share.zabbix.com platform was removed by Zabbix in favor of the Zabbix community-templates Github repository. Hence the above url to share.zabbix.com will no longer work.
My IPFire Zabbix template is however recently accepted into the Zabbix community-templates repository so next to my own Github repository, the template can now also be found at:
The current link in the wiki links to my own gitlab repo, which is normally the same template as in the Official Zabbix community templates repository (and may even be more recent at some point as I will continue development there and there will always be a delay in submitting changes to the community templates repo.)
I have also submitted a request for this IPFire template to be listed on the Zabbix Integrations platform; When/if that is accepted by the Zabbix team, I will put a link on the wiki to the Zabbix Integrations page for IPFire.
There is a nice dashboard in the images folder in your repo. However, after I’ve installed the template, I see 2 graphs and 0 dashboards. All 28 data points are fine.
The dashboard in the screenshot is an example of what global dashboard you could design using the values collected by the template more as a showcase of what values are monitored than anything else.
I’m afraid Zabbix frontend currently has no way to export or import global dashboards using the web ui. (It is possible using the API, if I recall correctly, but that won’t be very much of use to share as it will contain hard links to the monitored host on my system)
Host-level dashboards (which can be included in template exports) are not able to represent the data in the same way, if even possible, as on global dashboards. At least not up to Zabbix 6.4.
I will investigate if in Zabbix 7 I’m able to create a host-level dashboard that could provide such an overview, and can then be shared as part of the template as Zabbix 7, as I have read, made much improvements on host-level dashboard capabilities.
If not, I may consider writing out on how to create a global dashboard similar to the one in the screenshot. But that may take some time. So no promises yet.
So, in the mean time, feel free to experiment yourself designing your own dashboard; the dashboard in the current screenshot uses default Zabbix 6.4 dashboard widgets and the items as they are collected by the template I share. There is no hidden advanced magic, only a lot of clicking to design it
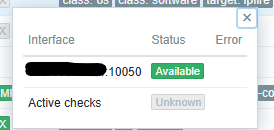
The Active checks availability indication is a feature since Zabbix 6.2. But since we use the 6.0 LTS release of the agent on IPFire, this feature is not yet supported by the agent on IPFire:
If Zabbix agents older than 6.2.x are used, they are not sending any active check heartbeats, so the availability of their hosts will remain unknown.
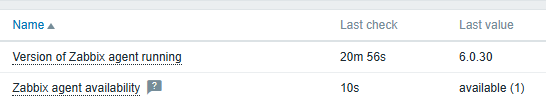
I’m not sure what check is behind the “Zabbix agent availability” item in your screenshot, as that item is not from my template.
If it is an agent.ping item, which works either in active or passive mode depending on the item Type, so this will normally always have a value of 1, and has to be checked with a nodata trigger expression to detect when the agent no longer sends a ping.
It could also be a Zabbix internal item type zabbix[host,active_agent,available] or zabbix[host,agent,available] which corresponds to the availability icons in the host list. (0 - unknown, 1 - available, 2 - not available). So in your case this item is probably the zabbix[host,agent,available], indicating the same “available” as the green “Available” in your screenshot.
I have set a FW rule to allow literally anything to go to the firewall from the Zabbix server, at 192.168.10.133, but when doing an snmpwalk from that server it fails with ref to 127.0.0.1 which is not even used.
IPfire Zabbix Log:
09:01:00
zabbix_agentd[27589]:
One child process died (PID:27594,exitcode/signal:9). Exiting ...
These are 2 different things: The addon for IPFire is the actual Zabbix Agent software that will be monitoring your IPFire instance. In the addon the agent is configured with a bunch of extra capabilities to monitor IPFire specific things natively without requiring extra user configuration on the agent side. But for the agent to actually monitor anything, it needs to hear from the Zabbix server what it actually should monitor. Without instructions from Zabbix Server, the Zabbix agent won’t do any monitoring at all. And that is where the template from my github comes in: That is a template set that you can import into Zabbix Server (Data Collection > Templates > Import). When you then assign this template onto your IPFire host in Zabbix, it will request all those IPFire specific monitoring items and the Agent addon installed on IPFire will start monitoring those items and provide the results back to the Zabbix Server.
It should start to present you data when you assign the template from my github to the IPFire host in Zabbix Server
The hostname of the host should match the hostname you set in the Zabbix Agent config:
So the fqdn should be as as “Hostname”. You can fill in surtveggur in the field “Visible name” to prevent visibly listing the full fqdn in your hostlist in Zabbix.
Next under “Interfaces” you should have an “Agent“ interface, where you fill in the IP and/or DNS name (check on the Zabbix host if you can resolve the DNS name of your IPFire instance) and select “IP” or “DNS” to specify which Zabbix should use to contact the agent on IPFire.
Port 10050 is the agent port.
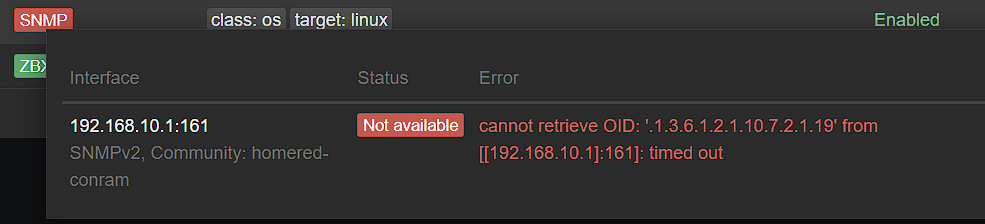
This is SNMP monitoring that you are trying. IPFire has no SNMP service running by default, so you won’t be able to monitor IPFire using SNMP without setting up an SNMP service on IPFire, which I do not recommend. Remove the SNMP interface and the, I assume, Linux by SNMP template you assigned to the host.
Monitoring happens through the Zabbix Agent addon.
If your Zabbix server is on GREEN, I don’t think you need to configure anything on the IPFire firewall for it to work if you have the firewall options set to Forward: Allow and Outgoing: Allow.
For most monitoring the Zabbix Agent on IPFire will initiate the contact (outgoing) with the Zabbix server on port 10051. Only a few checks (mainly openvpn/wireguard client monitoring) require Zabbix server access to IPFire (forward) on port 10050
You check if Zabbix Server to IPFire communications (Passive Agent) work with this command on the Zabbix Server:
which should return 1, indicating that the agent on IPFire is active and responds.
You can’t manually test the Active agent, but if that doesn’t work, you should see the Zabbix Agent complain about it in the logging every few minutes, that it can’t contact the Zabbix Server to get a list of active checks.
Next to the IPFire specific items that you can monitor using my template from my github, you can indeed monitor the Linux OS itself and even Squid, using the default Zabbix templates as provided by Zabbix. See www.ipfire.org - Zabbix Agent for details.
On a fresh installation of Zabbix Server, there is no need to import those templates, they should already be installed on your server by default. Hence you can just assign the “Linux by Zabbix agent active” template to the IPFire host, and the CPU, memory, disk usage etc, should all just start coming in.
For the Squid template, and maybe that is were the SNMP confusion started?, is indeed monitored by SNMP. For that to work, you have to enable the Squid built-in SNMP service like I pointed out in www.ipfire.org - Zabbix Agent . And then you will have to add a second interface on you IPFire host definition in Zabbix of the type SNMP, on the port you configured squid to listen on for SNMP requests. But again no Net-SNMP addon is required as this is built-in into squid.
“When you then assign this template onto your IPFire host in Zabbix, it will request all those IPFire specific monitoring items and the Agent addon installed on IPFire will start monitoring those items and provide the results back to the Zabbix Server.”
I got that to - after deleting and re-adding the IPFire Host :
With the warnings about VPN and such that you mentioned.
" To disable the trigger for a specific service (because it is disabled or you just don’t want notifications about that service) add a host macro {$IPFIRE.SERVICE.TRIGGER:"<service>"} to the IPFire host and set it to 0.
For example to disable the OpenVPN service trigger add {$IPFIRE.SERVICE.TRIGGER:"openvpn"} to the host. Check the discovered IPFire service item-keys for the correct service-name of each service.
Or you could opt to use the variables {$IPFIRE.SERVICENAME.MATCHES} and/or {$IPFIRE.SERVICENAME.NOT_MATCHES} to filter out services you don’t want to be monitored at all."
Yeah, well I will have to poke around to find that. Sorry for exposing you to my ignorance about Zabbix, but I just thought getting my IPFire monitored was a priority, so learning as doing.
–> The service will still be monitored, but there will be no alarms about it being down. It will however still be shown in the dashboard services honeycomb in a red color.
To remove OpenVPN server alltogether from the monitoring:
Add or change the value of {$IPFIRE.SERVICENAME.NOT_MATCHES} to a regular expression containing all services you want removed. For example ^(openvpn|charon)$ to remove both openvpn and ipsec vpn. Or the other way around, you can add/change the value of {$IPFIRE.SERVICENAME.MATCHES} to a regexp containing only those services you explicitly want to monitor. No other services will then be monitored.
Remark: this excludes these services from future service discovery, so if they where previously discovered by Zabbix, they will stay visible and be marked as no longer available (orange indicator next to the items), but will remain visible for 7 days (as is set in the template). After 7 days those monitoring items related to those services will automatically be removed from Zabbix including their histories. You can however manually remove those items with orange indicator from the host if you want them gone earlier.
For the correct name of a service, look at the related items in the latest data overview while the filter option “Show details” is checked:
This will add the item definition in green where you can get the actual service name as it is seen/known by Zabbix: