We are facing a situation where log data from our internal network isn’t reaching the Graylog system, even though we’ve set up Port 514 (UDP) for the task. Here’s what’s happening:
Within our internal network, we’ve ensured that Port 514 (UDP) is open on our IPFire. This should enable log data to send it to Graylog.
Graylog, our logging system, is fully configured to listen for incoming log data on Port 514. This is how it processes and presents log information.
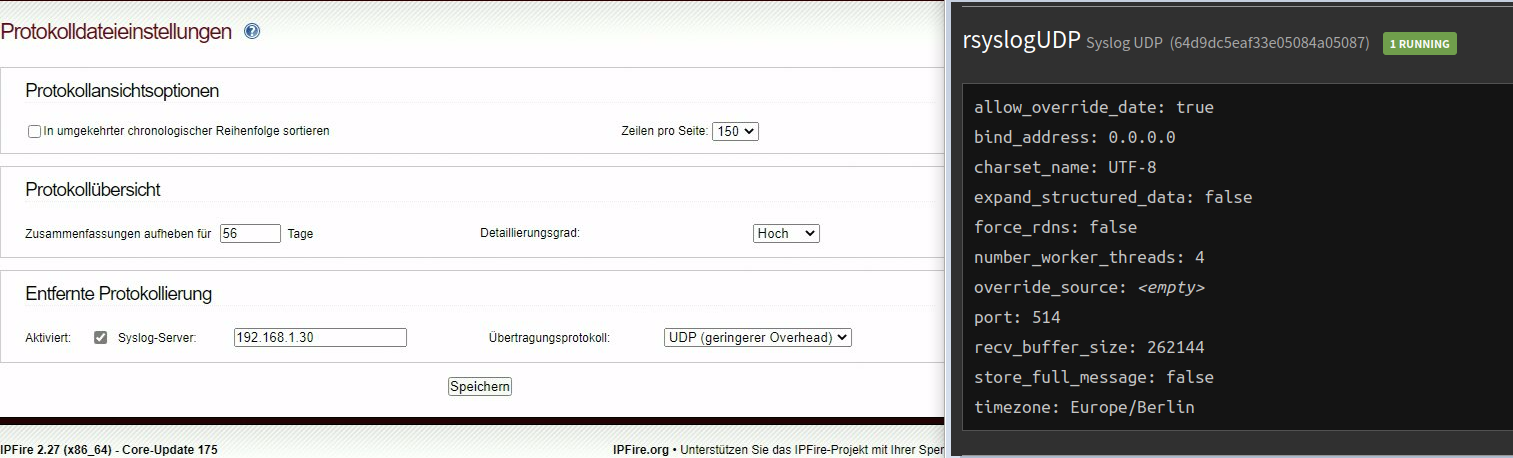
We’ve configured the IPFire to point to the remote log server.
The issue persists: The logs are not being successfully received by the Graylog system. There are no indications in the logs or similar sources.
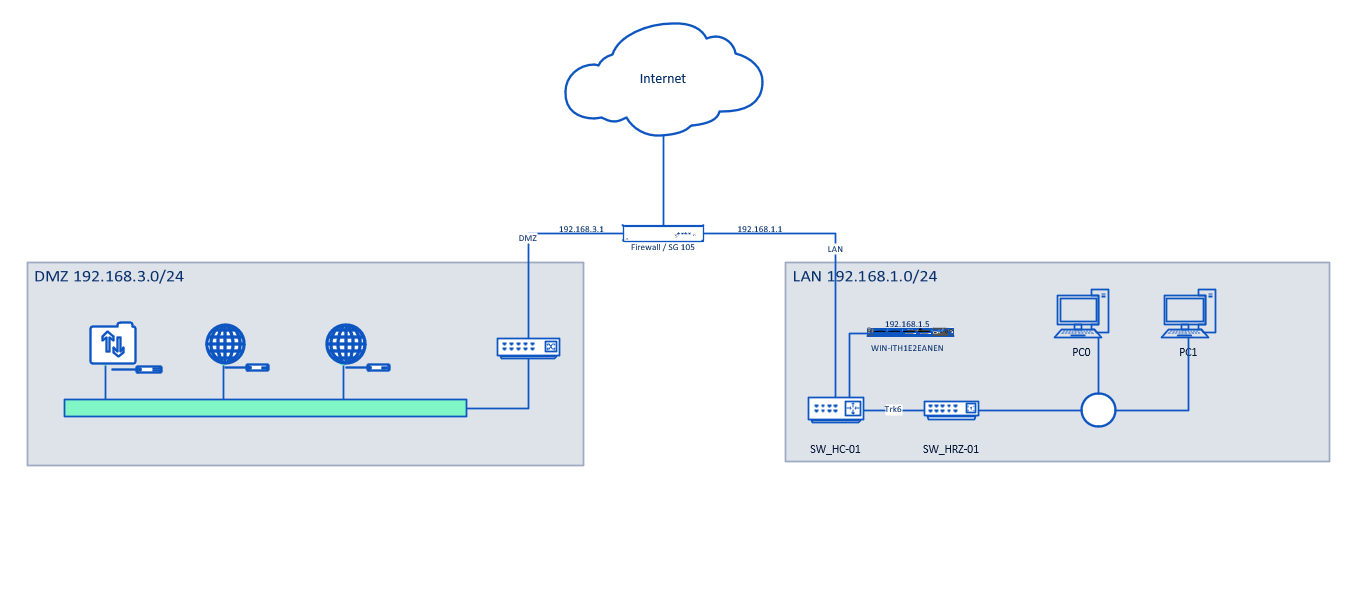
Is the graylog platform installed in a machine running in the green network?
Which machine fails to send the logs to graylog, IPFire? Or other machines in your LAN? If the latter, are they in the blue network or are they all on the green network? Is it a simple green network, or do you have other routers or layer 3 switches creating a more complex LAN?
In any case, it would be nice to have a diagram of the networks structure.
(IPFire) Everything is happening in the right box. The DMZ is not set up and doesn’t play a role in the issue. So, it’s related to the green network or LAN. I managed to get the Windows Servers in Graylog, as well as the Linux machines. You can imagine that, for instance, PC0 is the Graylog Server. These are Layer 3 switches.
To troubleshoot I would install tcpdump on the IPFire machine and watch for UDP traffic destined for PC0 IP. Also, this tutorial of sysklogd (used by IPFire) might give you some idea for troubleshooting.
For example:
Use tcpdump to monitor syslog traffic:
Say PC0 IP is 10.1.1.103. Start tcpdump on your IPFire machine to capture UDP packets destined for 10.1.1.103 on port 514 (the standard syslog port). You can do this with the following command:
tcpdump -i green0 -n udp dst 10.1.1.103 and port 514
You could use any to capture on all interfaces, but be cautious as this might display a lot of traffic.
Generate a test log message with logger:
In another terminal or session on the IPFire machine, generate a test log message using the logger command. For example:
logger "This is a test log message for Graylog"
Verify the traffic with tcpdump:
After sending the test log message, switch back to the terminal or session where tcpdump is running. You should see one or more captured packets that indicate the log message being sent to 10.1.1.103.
Check Graylog:
Finally, verify on the Graylog server to ensure that the test log message was received.
This process allows you to observe and confirm the log message’s path from the IPFire system to the Graylog server. If you don’t see the expected packets in tcpdump, then there might be an issue with the syslog configuration or some network issue.