Suddenly no access to UI of IPFire from my PC

Hi,

does the UI of IPFire have a kind of Fial2ban built in?

I was on IPFire’s UI today to set up a firewall rule for another device. Suddenly I no more access the UI from my PC in the green network and the browser shows me “Connection failed”. I can access it from another PC on the green network without any problems.

Restarting IPFire did not help :wink:

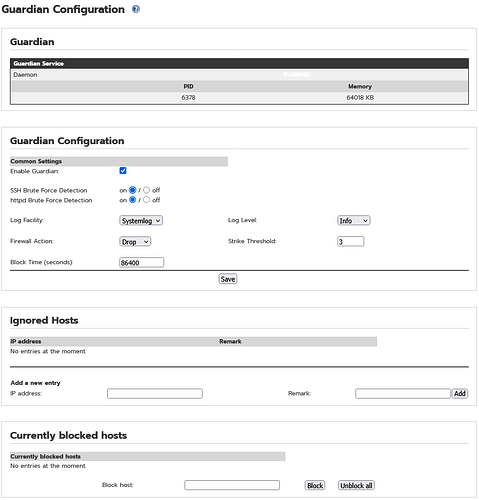
If you installed the Guardian addon and enabled it for checking for errors in login on the WUI then yes it does.
I believe that Guardian has a default setting of 3 errors when trying to log in and once triggered the IP would be blocked for around 24 hours.

If you don’t have Guardian installed then there is no other fail2ban system in place.
Then your best bet would be to review the logs via the console setting to see what is causing the block of accessing the WUI.

1 Like

Hi, @bonnietwin!
Sorry, I’m new with IPFiire!
Where can I find the logs?
Do I need access vis SSH?

De activate your firewall rule.
This is probably your problem.

On the console the logs file is /var/log/messages which you can search with the grep command.

Alternatively if you can access the WUI from another PC then you could look in the logs on that machine.

I would suggest looking at the menu Logs - Firewall Logs and press the update button. Then after the logs have updated attempt to access the WUI on the machine with the problem and then go and press the update button on the Logs - Firewall Logs entry again and see what new log messages you can see, especially any that have the IP address for the system having the problem or where the Dst Port number is 444

2 Likes

Also worth doing is to check the network connection between the PC having a problem and your IPFire.

Either via the console or via ssh on the PC that you can connect with get a terminal window into your IPFire and run the command ping -c4 192.168.82.32, replacing the IP address I used with the IP address that the PC with the problem is supposed to be using.

If everything is working you will get something similar to

ping -c4 192.168.26.32
PING 192.168.26.32 (192.168.26.32) 56(84) bytes of data.
64 bytes from 192.168.26.32: icmp_seq=1 ttl=64 time=0.596 ms
64 bytes from 192.168.26.32: icmp_seq=2 ttl=64 time=0.613 ms
64 bytes from 192.168.26.32: icmp_seq=3 ttl=64 time=0.748 ms
64 bytes from 192.168.26.32: icmp_seq=4 ttl=64 time=0.475 ms

--- 192.168.26.32 ping statistics ---
4 packets transmitted, 4 received, 0% packet loss, time 3004ms
rtt min/avg/max/mdev = 0.475/0.608/0.748/0.096 ms

except that the IP address will be different.

If there is a network connection problem to that PC then you will see somethging similar to

ping -c4 192.168.26.85
PING 192.168.26.85 (192.168.26.85) 56(84) bytes of data.
From 192.168.26.230 icmp_seq=1 Destination Host Unreachable
From 192.168.26.230 icmp_seq=2 Destination Host Unreachable
From 192.168.26.230 icmp_seq=3 Destination Host Unreachable
From 192.168.26.230 icmp_seq=4 Destination Host Unreachable

--- 192.168.26.85 ping statistics ---
4 packets transmitted, 0 received, +4 errors, 100% packet loss, time 3059ms
pipe 4
1 Like

Hi @bonnietwin,

ping ist not a problem.

ping 192.168.200.1
PING 192.168.200.1 (192.168.200.1) 56(84) Bytes an Daten.
64 Bytes von 192.168.200.1: icmp_seq=1 ttl=64 Zeit=0.203 ms
64 Bytes von 192.168.200.1: icmp_seq=2 ttl=64 Zeit=0.616 ms
64 Bytes von 192.168.200.1: icmp_seq=3 ttl=64 Zeit=0.630 ms
64 Bytes von 192.168.200.1: icmp_seq=4 ttl=64 Zeit=0.696 ms

nmap give me following output:

nmap -p 444 192.168.200.1
Starting Nmap 7.95 ( https://nmap.org ) at 2025-02-14 18:48 CET
Nmap scan report for ipfire.host (192.168.200.1)
Host is up (0.15s latency).

PORT    STATE  SERVICE
444/tcp closed snpp

Nmap done: 1 IP address (1 host up) scanned in 6.82 seconds

In the log file of IPFire I can see the following when I try to connect:

18:43:14  DNAT  IN=green0 OUT= MAC=7c:5a:1c:d9:95:64:3c:7c:3f:c3:65:b7:08:00 SRC=192.168.200.21 DST=192.168.200.1 LEN=60 TOS=0x00 PREC=0x00 TTL=64 ID=14282 DF PROTO=TCP SPT=42406 DPT=444 WINDOW=64240 RES=0x00 SYN URGP=0
18:43:14  FORWARDFW  IN=green0 OUT=blue0 MAC=7c:5a:1c:d9:95:64:3c:7c:3f:c3:65:b7:08:00 SRC=192.168.200.21 DST=192.168.150.100 LEN=60 TOS=0x00 PREC=0x00 TTL=63 ID=14282 DF PROTO=TCP SPT=42406 DPT=444 WINDOW=64240 RES=0x00 SYN URGP=0
18:43:16  DNAT  IN=green0 OUT= MAC=7c:5a:1c:d9:95:64:3c:7c:3f:c3:65:b7:08:00 SRC=192.168.200.21 DST=192.168.200.1 LEN=60 TOS=0x00 PREC=0x00 TTL=64 ID=53536 DF PROTO=TCP SPT=60382 DPT=444 WINDOW=64240 RES=0x00 SYN URGP=0
18:43:16  FORWARDFW  IN=green0 OUT=blue0 MAC=7c:5a:1c:d9:95:64:3c:7c:3f:c3:65:b7:08:00 SRC=192.168.200.21 DST=192.168.150.100 LEN=60 TOS=0x00 PREC=0x00 TTL=63 ID=53536 DF PROTO=TCP SPT=60382 DPT=444 WINDOW=64240 RES=0x00 SYN URGP=0
18:43:18  DNAT  IN=green0 OUT= MAC=7c:5a:1c:d9:95:64:3c:7c:3f:c3:65:b7:08:00 SRC=192.168.200.21 DST=192.168.200.1 LEN=60 TOS=0x00 PREC=0x00 TTL=64 ID=39326 DF PROTO=TCP SPT=60384 DPT=444 WINDOW=64240 RES=0x00 SYN URGP=0
18:43:18  FORWARDFW  IN=green0 OUT=blue0 MAC=7c:5a:1c:d9:95:64:3c:7c:3f:c3:65:b7:08:00 SRC=192.168.200.21 DST=192.168.150.100 LEN=60 TOS=0x00 PREC=0x00 TTL=63 ID=39326 DF PROTO=TCP SPT=60384 DPT=444 WINDOW=64240 RES=0x00 SYN URGP=0
18:43:22  DNAT  IN=green0 OUT= MAC=7c:5a:1c:d9:95:64:3c:7c:3f:c3:65:b7:08:00 SRC=192.168.200.21 DST=192.168.200.1 LEN=60 TOS=0x00 PREC=0x00 TTL=64 ID=60910 DF PROTO=TCP SPT=60396 DPT=444 WINDOW=64240 RES=0x00 SYN URGP=0
18:43:22  FORWARDFW  IN=green0 OUT=blue0 MAC=7c:5a:1c:d9:95:64:3c:7c:3f:c3:65:b7:08:00 SRC=192.168.200.21 DST=192.168.150.100 LEN=60 TOS=0x00 PREC=0x00 TTL=63 ID=60910 DF PROTO=TCP SPT=60396 DPT=444 WINDOW=64240 RES=0x00 SYN URGP=0
18:43:26  DNAT  IN=green0 OUT= MAC=7c:5a:1c:d9:95:64:3c:7c:3f:c3:65:b7:08:00 SRC=192.168.200.21 DST=192.168.200.1 LEN=60 TOS=0x00 PREC=0x00 TTL=64 ID=15788 DF PROTO=TCP SPT=60412 DPT=444 WINDOW=64240 RES=0x00 SYN URGP=0
18:43:26  FORWARDFW  IN=green0 OUT=blue0 MAC=7c:5a:1c:d9:95:64:3c:7c:3f:c3:65:b7:08:00 SRC=192.168.200.21 DST=192.168.150.100 LEN=60 TOS=0x00 PREC=0x00 TTL=63 ID=15788 DF PROTO=TCP SPT=60412 DPT=444 WINDOW=64240 RES=0x00 SYN URGP=0
18:43:26  DNAT  IN=green0 OUT= MAC=7c:5a:1c:d9:95:64:3c:7c:3f:c3:65:b7:08:00 SRC=192.168.200.21 DST=192.168.200.1 LEN=60 TOS=0x00 PREC=0x00 TTL=64 ID=31778 DF PROTO=TCP SPT=49600 DPT=444 WINDOW=64240 RES=0x00 SYN URGP=0
18:43:26  FORWARDFW  IN=green0 OUT=blue0 MAC=7c:5a:1c:d9:95:64:3c:7c:3f:c3:65:b7:08:00 SRC=192.168.200.21 DST=192.168.150.100 LEN=60 TOS=0x00 PREC=0x00 TTL=63 ID=31778 DF PROTO=TCP SPT=49600 DPT=444 WINDOW=64240 RES=0x00 SYN URGP=0
18:43:27  DNAT  IN=green0 OUT= MAC=7c:5a:1c:d9:95:64:3c:7c:3f:c3:65:b7:08:00 SRC=192.168.200.21 DST=192.168.200.1 LEN=60 TOS=0x00 PREC=0x00 TTL=64 ID=28527 DF PROTO=TCP SPT=49614 DPT=444 WINDOW=64240 RES=0x00 SYN URGP=0
18:43:27  FORWARDFW  IN=green0 OUT=blue0 MAC=7c:5a:1c:d9:95:64:3c:7c:3f:c3:65:b7:08:00 SRC=192.168.200.21 DST=192.168.150.100 LEN=60 TOS=0x00 PREC=0x00 TTL=63 ID=28527 DF PROTO=TCP SPT=49614 DPT=444 WINDOW=64240 RES=0x00 SYN URGP=0
18:43:28  DNAT  IN=green0 OUT= MAC=7c:5a:1c:d9:95:64:3c:7c:3f:c3:65:b7:08:00 SRC=192.168.200.21 DST=192.168.200.1 LEN=60 TOS=0x00 PREC=0x00 TTL=64 ID=41029 DF PROTO=TCP SPT=49626 DPT=444 WINDOW=64240 RES=0x00 SYN URGP=0
18:43:28  FORWARDFW  IN=green0 OUT=blue0 MAC=7c:5a:1c:d9:95:64:3c:7c:3f:c3:65:b7:08:00 SRC=192.168.200.21 DST=192.168.150.100 LEN=60 TOS=0x00 PREC=0x00 TTL=63 ID=41029 DF PROTO=TCP SPT=49626 DPT=444 WINDOW=64240 RES=0x00 SYN URGP=0

Why is there a DNAT and FORWARDFW log? If you are connecting from the GREEN LAN to green0, you should just have some sort of INPUT log (INPUTFW?). The FORWARDFW log looks like it is forwarding to blue0. I suspect you have a faulty rule in there.

1 Like

You shouldn’t need a rule at all to access the wui from green.

The fact that you have firewall hits related to port 444 going from green to blue suggests a faulty rule as @nickh suggests.

As you can’t access the WUI on that PC then you can also not disable any faulty firewall rule via the WUI. Therefore you will need to do this by editing a file on IPFire.

Access via ssh from the other PC or via the console and look at the file
/var/ipfire/firewall/config
which contains the Firewall Rules.

Each entry will start something similar to

5,ACCEPT,FORWARDFW,,src_addr,....
1,REJECT,FORWARDFW,ON,std_net_src,....
3,ACCEPT,FORWARDFW,ON,src_addr,....
4,ACCEPT,FORWARDFW,,src_addr,....
2,ACCEPT,FORWARDFW,ON,src_addr,....

except you might have other chains specified than FORWARDFW.

Make a copy of the file befrore editing it as a safety precaution.

You have the rule number first, then the action (accept, reject or drop), then the chain (FORWARDFW in the above example) and then the status of the rule which will either be blank or say ON.

Change all rules that have ON to being blank, ie from ,ON, to ,,

Then save the file.

Then restart the firewall with the command
/etc/rc.d/init.d/firewall reload

It should then take account of the changed config file and update your firewall rules to be disabled.

Then you can check if you can now access the WUI on the original PC.

EDIT:
I just tested the above out on a test system I have and was able to successfully disable all the firewall rules I had and then reload the firewall and then again enable the rules and reload the firewall. In each case I could see the effect in my WUI screen (after refreshing the browser page).

1 Like

From the other machine that you can access it from, navigate to Services->Guardian. See if your first machine is listed at the bottom as blocked. If it is, click the Unblock button in the bottom right corner.

1 Like

Thank you very much for your help!

I have located and deleted the firewall rule that was causing the problems. I had already created the rule weeks ago, so I’m a bit surprised.

Did you activate the rule by pressing the Apply Changes button at the top of the Firewall Rules page. This is only shown when a rule has been created but not yet activated.

Did you later on reboot your IPFire. If yes, then any firewall rule that had been created but not applied would then become applied after a reboot.

4 Likes