QOS code changes - Trying to not get this too wrong

Disclaimer: Anything to do with ipfire; I could absolutely be wrong, confused, or incorrect…

I made some changes to the makeqosscripts.pl:

 my @cake_options = (
        # RED is by default connected to the Internet
-       "internet"
+       "internet diffserv4 wash ack-filter raw"
..
-               print "\ttc qdisc add dev $qossettings{'DEVICE'} parent 1:$qossettings{'CLASS'} handle $qossettings{'CLASS'}: cake @cake_options\n";
+               print "\ttc qdisc add dev $qossettings{'DEVICE'} parent 1:$qossettings{'CLASS'} handle $qossettings{'CLASS'}: cake docsis nat egress overhead 20  @cake_options\n";
..
-               print "\ttc qdisc add dev $qossettings{'DEVICE'} parent 2:$qossettings{'CLASS'} handle $qossettings{'CLASS'}: cake @cake_options\n";
+               print "\ttc qdisc add dev $qossettings{'DEVICE'} parent 2:$qossettings{'CLASS'} handle $qossettings{'CLASS'}: cake ethernet ingress overhead 20  @cake_options\n";

Which then returns this:

 tc qd show
qdisc noqueue 0: dev lo root refcnt 2
qdisc htb 1: dev red0 root refcnt 5 r2q 10 default 0x110 direct_packets_stat 1 direct_qlen 1000
qdisc cake 120: dev red0 parent 1:120 bandwidth unlimited diffserv4 triple-isolate nat wash ack-filter split-gso rtt 100ms raw overhead 18 mpu 64
qdisc cake 102: dev red0 parent 1:102 bandwidth unlimited diffserv4 triple-isolate nat wash ack-filter split-gso rtt 100ms raw overhead 18 mpu 64
qdisc cake 104: dev red0 parent 1:104 bandwidth unlimited diffserv4 triple-isolate nat wash ack-filter split-gso rtt 100ms raw overhead 18 mpu 64
qdisc cake 110: dev red0 parent 1:110 bandwidth unlimited diffserv4 triple-isolate nat wash ack-filter split-gso rtt 100ms raw overhead 18 mpu 64
qdisc cake 101: dev red0 parent 1:101 bandwidth unlimited diffserv4 triple-isolate nat wash ack-filter split-gso rtt 100ms raw overhead 18 mpu 64
qdisc cake 103: dev red0 parent 1:103 bandwidth unlimited diffserv4 triple-isolate nat wash ack-filter split-gso rtt 100ms raw overhead 18 mpu 64
qdisc ingress ffff: dev red0 parent ffff:fff1 ----------------

qdisc fq_codel 8002: dev green0 root refcnt 5 limit 10240p flows 1024 quantum 1514 target 5ms interval 100ms memory_limit 32Mb ecn drop_batch 64

qdisc htb 2: dev imq0 root refcnt 2 r2q 10 default 0x210 direct_packets_stat 0 direct_qlen 32
qdisc cake 203: dev imq0 parent 2:203 bandwidth unlimited diffserv4 triple-isolate nonat wash ingress ack-filter split-gso rtt 100ms raw overhead 18 mpu 64
qdisc cake 220: dev imq0 parent 2:220 bandwidth unlimited diffserv4 triple-isolate nonat wash ingress ack-filter split-gso rtt 100ms raw overhead 18 mpu 64
qdisc cake 200: dev imq0 parent 2:200 bandwidth unlimited diffserv4 triple-isolate nonat wash ingress ack-filter split-gso rtt 100ms raw overhead 18 mpu 64
qdisc cake 204: dev imq0 parent 2:204 bandwidth unlimited diffserv4 triple-isolate nonat wash ingress ack-filter split-gso rtt 100ms raw overhead 18 mpu 64
qdisc cake 210: dev imq0 parent 2:210 bandwidth unlimited diffserv4 triple-isolate nonat wash ingress ack-filter split-gso rtt 100ms raw overhead 18 mpu 64

confused by the fq_codel (still) on the green0 link…

confused with what imq0 is attached to… (I understand it itself is virtual, but what physically loads its queue?)

htb 1 is attached to red0 (makes sense)

htb 2 is attached to imq0 (looking at -github.com/imq/linuximq/wiki/UsingIMQ) I don’t see any rules for green to imq (iptables -L -v -n)

(at the end of this… I found this seems to make a difference…)

tc qd replace dev green0 root cake diffserv4 ack-filter

but if I can’t prove that I don’t really know if I’m doing something that makes a difference…

I’m a 300/30 docsis

I am new to ipfire, running since 187… I wanted to see how cake’s ack filtering and an imq ack prioritization looks like… but the 101 class says it’s icmp (?)

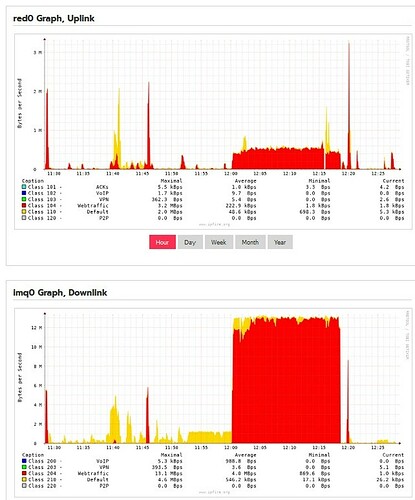
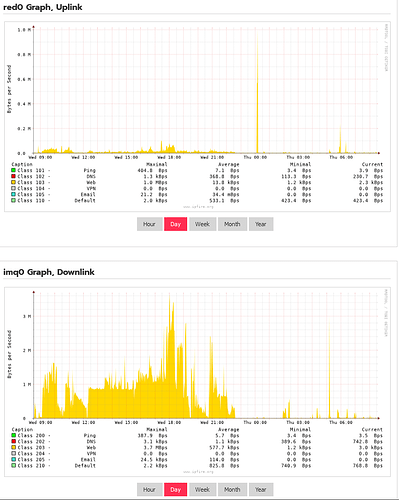
I don’t know how other people’s imq graphs look… here’s mine

-imgur.com/a/ukixlbJ

the big change is when I removed ack-filter from cake… (I think…)

-imgur.com/a/ukixlbJ

added ack-filter back in…

I also have tailscale running in the house which is the exit node for three devices…

I am trying to get the most of the link (obviously)… no one says their interweb is too fast…

Open to suggestions, criticism, corrections…

Thank you in advance.
Hello! Welcome to the IPFire Community!

FYI - I edited your post to add the image. There were two image links above but for the same URL and same image.

Please add your images directly to the Community. As a new user there is a limit to the amount of images posted (sorry I do not remember the limit number)

Also, please post a paragraph on what you are trying to accomplish with your changes to QOS.

1 Like

Thank you for the update…

The imgur link should have two images in it…

Using the stock qos settings things don’t feel right, and the graphs don’t look right… so I’m trying to understand what the graphs should look like…

(for starters)

changing green0 from fq_codel to cake and then adding ack-filtering seems to radically remove class 104 and 204 from the imq graph…

which also does not make sense…


Moderator note: do not add a link to the image. just add the image directly to your post.

If you haven’t already, have a read through the QoS documentation, especially the links at the bottom to the Example Customized QoS.

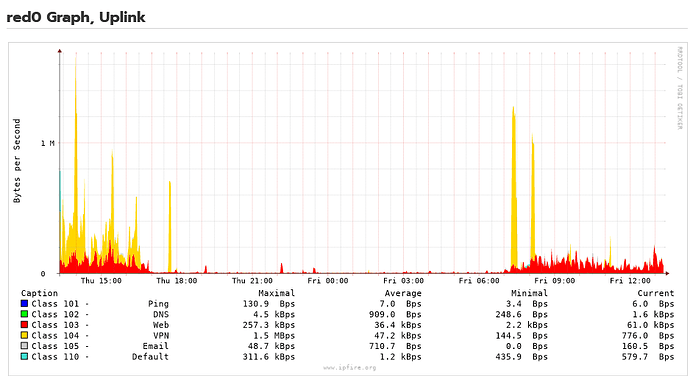
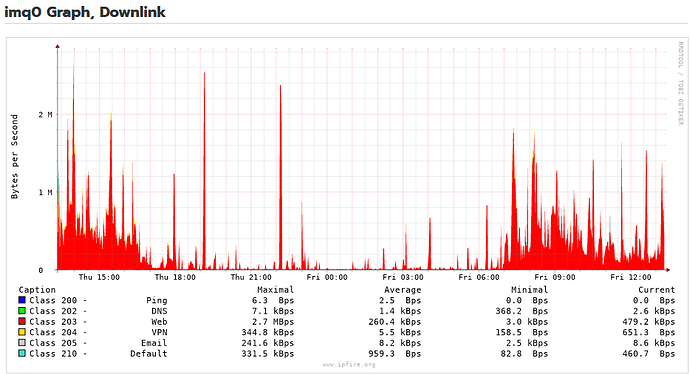
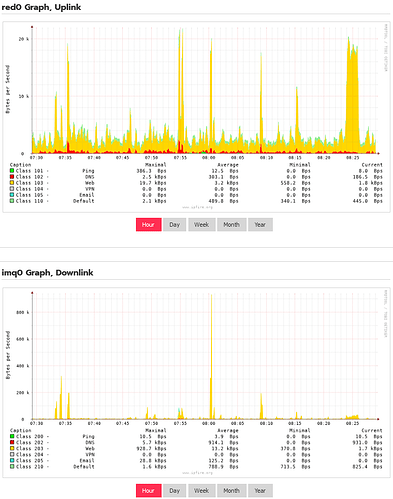
Here is what my (customized) QoS graphs look like:


edit: it looks like your downlink is not exceeding 100Mbps. Have you set up the downlink and uplink speeds at the top to be 300/30? Also, QoS is pretty computationally heavy, and if the cpu in your IPFire is not very fast, it may bottleneck the bandwidth, which might also explain your graphs capping at 100Mbps. There is a thread here where that was discussed pretty exhaustively. When I find it, I’ll link to it here.

Here it is:

2 Likes

Remember there are three tables in iptables, filter, nat and mangle. Filter is the default if not specified. You can view the others with iptables -nvL -t nat and iptables -nvL -t mangle.

https://www.waveform.com/tools/bufferbloat?test-id=7bf46374-190e-40b9-b44b-de89cc1a5809

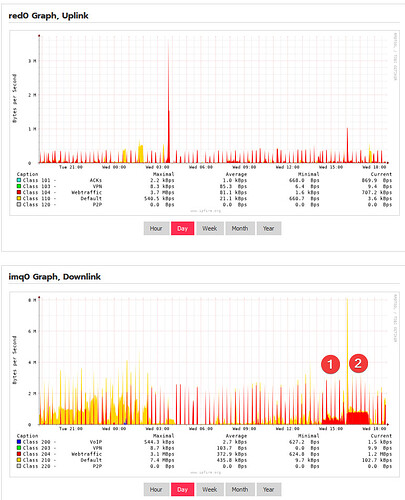
We got the kids a google nest max screen…

1 is us watching Netflix via a chromecast (no problems)

2 is us calling and having a Google Meet (their video was pixelated at times) audio was clear.

Assuming CPU is fine…

]# head -n 28 /proc/cpuinfo
processor       : 0
vendor_id       : GenuineIntel
cpu family      : 6
model           : 156
model name      : Intel(R) Celeron(R) N5105 @ 2.00GHz
stepping        : 0
microcode       : 0x24000026
cpu MHz         : 800.000
cache size      : 4096 KB
physical id     : 0
siblings        : 4
core id         : 0
cpu cores       : 4
apicid          : 0
initial apicid  : 0
fpu             : yes
fpu_exception   : yes
cpuid level     : 27
wp              : yes
flags           : fpu vme de pse tsc msr pae mce cx8 apic sep mtrr pge mca cmov pat pse36 clflush dts acpi mmx fxsr sse sse2 ss ht tm pbe syscall nx rdtscp lm constant_tsc art arch_perfmon pebs bts rep_good nopl xtopology nonstop_tsc cpuid aperfmperf tsc_known_freq pni pclmulqdq dtes64 monitor ds_cpl vmx est tm2 ssse3 sdbg cx16 xtpr pdcm sse4_1 sse4_2 x2apic movbe popcnt tsc_deadline_timer aes xsave rdrand lahf_lm 3dnowprefetch cpuid_fault epb cat_l2 cdp_l2 ssbd ibrs ibpb stibp ibrs_enhanced tpr_shadow flexpriority ept vpid ept_ad fsgsbase tsc_adjust smep erms rdt_a rdseed smap clflushopt clwb intel_pt sha_ni xsaveopt xsavec xgetbv1 xsaves split_lock_detect dtherm ida arat pln pts hwp hwp_notify hwp_act_window hwp_epp hwp_pkg_req vnmi umip waitpkg gfni rdpid movdiri movdir64b md_clear flush_l1d arch_capabilities
vmx flags       : vnmi preemption_timer posted_intr invvpid ept_x_only ept_ad flexpriority apicv tsc_offset vtpr mtf vapic ept vpid unrestricted_guest vapic_reg vid ple shadow_vmcs ept_mode_based_exec tsc_scaling usr_wait_pause
bugs            : spectre_v1 spectre_v2 spec_store_bypass swapgs srbds mmio_stale_data rfds bhi
bogomips        : 3993.60
clflush size    : 64
cache_alignment : 64
address sizes   : 39 bits physical, 48 bits virtual
power management:

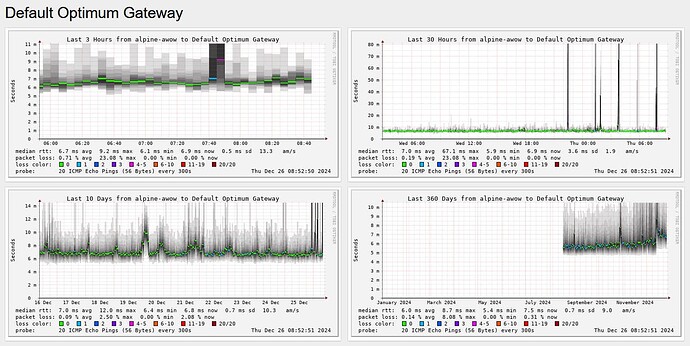
Do you know what all those tiny spikes are from? A combination of web and default. It looks like some device or devices are communicating briefly every 15-20 minutes.

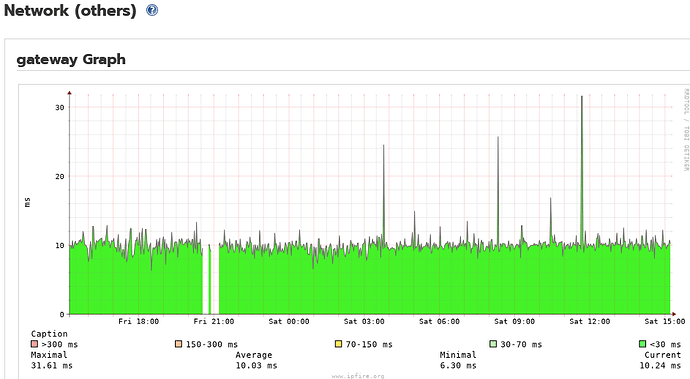
It is nowhere near to saturating your line based on your 300/30 connection. When this happens again, check your Gateway Graph at Status->Network (others). This graph should be pretty smooth almost all the time if QoS is working well. If you see tall spikes centered around the time you are having problems, that probably means that some buffer somewhere is getting “bloated”. However, if the gateway graph looks smooth and your QoS graph shows bandwidth use well under your ISPs limit, it could also be that something outside of your control is responsible for for the pixelated video (or whatever issue you are experiencing). Meaning, it could be on the ISPs end or any hop between you and your destination. If it was on Christmas Day, it could’ve been due to congestion from everyone else in the world using it at the same time.

My son or wife will sometimes complain that the internet is slow, or keeps dropping. Whenever I check IPFire during those times, it’s usually the case that everything on our end is fine and whatever they are experiencing is originating on the remote side.

White (blank) gaps in the gateway graph indicate no connectivity with the ISP gateway. Here is what an ISP outage looks like:

If you don’t see those, you know you are successfully pinging the gateway and there are no “drops” occuring between IPFire and the ISP gateway.

Tall spikes on the gateway graph indicate slow pings to the gateway, which usually means buffer bloat is occurring.

Your first post inspired me to update my 10 year old post on QoS customization. Have a read here:

Yes, the N5105 is capable of 300Mbps with QoS on. I have that cpu in one of my IPFire devices.

Now that I ‘feel more better’ about this…

[root@ipfire qos]# grep 211 *
grep: bin: Is a directory
classes:imq0;211;6;1;335250;;;0;Default;
portconfig:211;imq0;tcp;192.168.88.200;;;;
portconfig:211;imq0;udp;192.168.88.200;;;;
[root@ipfire qos]# grep 212 *
grep: bin: Is a directory
classes:imq0;212;6;1;335250;;;0;Default;
portconfig:212;imq0;tcp;192.168.88.250;;;;
portconfig:212;imq0;udp;192.168.88.250;;;;
[root@ipfire qos]# grep 213 *
grep: bin: Is a directory
classes:imq0;213;6;1;335250;;;0;Default;
portconfig:213;imq0;tcp;192.168.88.254;;;;
portconfig:213;imq0;udp;192.168.88.254;;;;

Maybe I’ll find out which of those (mix of Alpine & Arch docker machines…)

(smokeping via docker on Alpine baremetal… and network_mode: hosts)

again trying to help myself more than hurt myself…

and upset as few people in the house along the way…

(thank you in advance…)

somewhat OT…

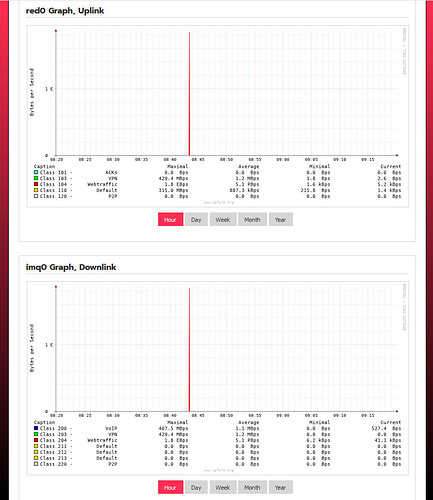
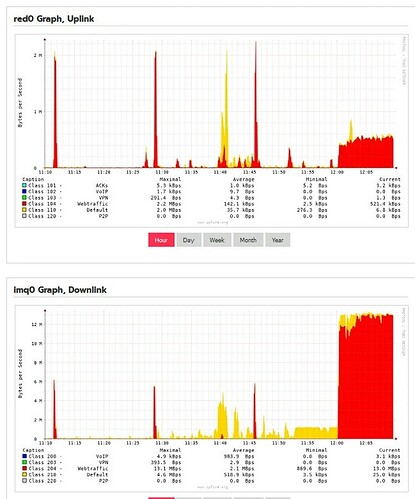
This is what happens when I restart… I have to wait an hour to see results…

It looks like you set some custom classes specific to your Alpine and Archer machines. I have had weird experiences when adding classes beyond 110/210, similar to the spike you’re showing in the follow up post. That spike is so unbelievably high that it masks everything else on the graph, until it passes offscreen to the left after an hour.

I have learned to stick to 101-110 for red0 and 200-210 for imq0. Everything behaves well.

The other thing I saw is your maximal speed is set to 335250, which might be a little too high for a 300Mbps connection. As a test, try dropping that number to something around 300000 or less and see how it affects your setup. You could always raise it back up if there is no improvement.