Pmacct - A lightweight passive network monitoring tool

Hi jon,

if you want to sort it out in the Sqlite way (there is more) you can try this via the ‘WHERE’ clause.

Example is given with a /24 subnet named ‘192.168.1.0’ which will be excluded if ‘ip_src’ and ‘ip_dst’ are within the same row. IPv6 entries are also excluded as an example (Multicast and Broadcast should work in the same way):

# Sqlite query ordered by bytes and exclude LAN2LAN (if LAN address is 192.168.1.*) and IPv6 traffic
sqlite3 ${DB} <<"EOF"
.headers ON
.mode column
SELECT
	ip_src,
	ip_dst,
	packets,
	bytes,
	stamp_inserted,
	stamp_updated
FROM
	acct
WHERE
	ip_src AND ip_dst NOT LIKE "192.168.1.%"
AND
	ip_src AND ip_dst NOT LIKE "%::%"
ORDER BY
	bytes DESC;
EOF

‘%’ is here the wildcard /16 subnet can be excluded e.g. with a “192.168.%” .

As a first idea which needs to be tested a little.

Best,

Erik

1 Like

Hi Erik - Thank you! You are the BEST!

I’m trying to break down the query and I don’t quite understand this line:
ip_src AND ip_dst NOT LIKE "%::%

I see that the query deletes anything like fe80::22c9:d ff02::fb

Is this an IPv6 broadcast type message?

I changed the logic slightly to get the LAN2LAN eliminated. Hope this is correct.

NOT (ip_src LIKE "192.168.60.%" AND ip_dst LIKE "192.168.60.%")

Hi Jon,
“fe80” addresses are “Link-local addresses” which are mostly automatically assigned if the interface can do IPv6 even there is no IPv6 communication available, those addresses are also only valid for local communication or inside your network segment, broadcast can be also a part of this.

If you have 192.168.60.0/24 it is. If you use also the interfaces.map for more interfaces and the other segments do use also ‘192.168’ you can filter it further into a /16 subnet like this “192.168.%” .

It might be a good idea to check this a little further and keep an idea of the results. The best might be to compare the results also with a non filtered Sqlite query.

Best,

Erik

1 Like

Hi Erik,

Thank you for all of your help! This is great! And thanks for the IPv6 info. It all helps!

Yes, my local network is 192.168.60.0/24. But I don’t understand the second line:

If you use also the interfaces.map for more interfaces and the other segments do use also ‘192.168’ you can filter it further into a /16 subnet like this “192.168.%” .

I found /etc/pmacct/examples/pcap_interfaces.map.example and /etc/pmacct/examples/peers.map.example but this seems way over my head! :exploding_head:. So I’m not sure if it will help me.

I’ve been doing this - (thank you!) That is how I figured out the ip_src AND ip_dst NOT LIKE "192.168.60.%" was not working for me.


There is a firehose of information in the DB. In two days I see about 120,000 lines in the DB. I’m having trouble consolidating things even more.

I’ve been doing post processing within MS Excel and a Pivot table and this seems to be where I want to get to:

Date (by day)
    Source (ip_src = 192.168.60.%)
        Destination (ip_dst)
            Bytes (bytes in kilobytes)

Date (by day)
    Destination (ip_dst = 192.168.60.%)
        Source (ip_src)
            Bytes (bytes in kilobytes)

So the big question for me: Is this done with the help of pmacct or a sql query or post processing the data (like with Excel)?

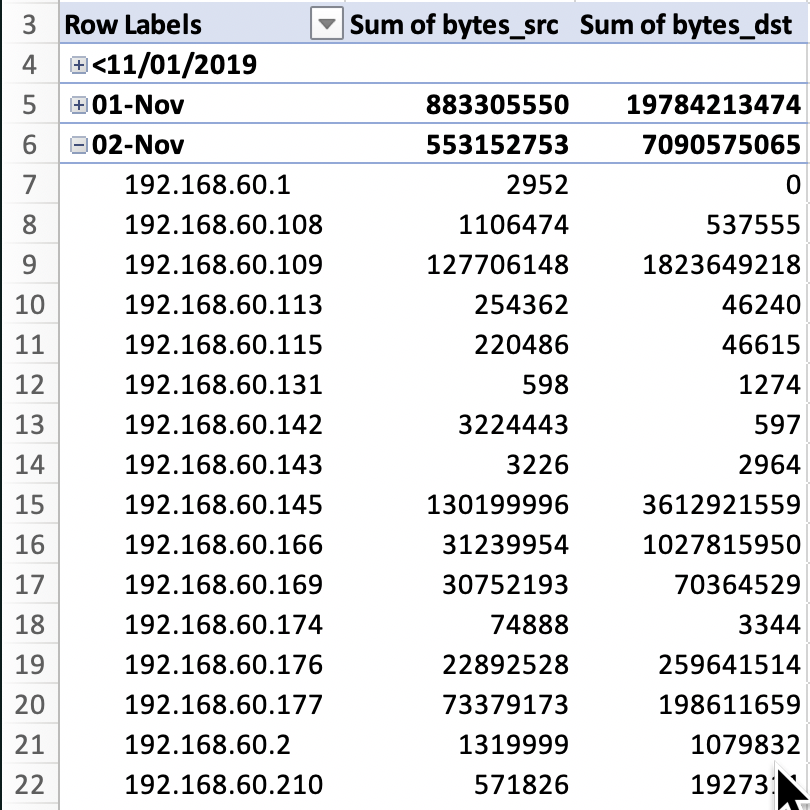
Instead of two worksheets I now have one:

But it involves conditional formulas and a pivot table to work. Same type of question: can pmacct or a sql query help? Or is everything done as a post process (like using Excel or something else)?

Hi Jon,

the interfaces.map should include all parameter for IPFire related interfaces. In that case you can only comment the not needed ones with an ‘!’ or simply delete the entries. But this should not be the part which gives you your wanted output.

Is there nothing or is it only not that desired result ?

This should be possible but am currently need also to try it out, my SQLite Fu is currently not the best :cry: .

Will be back if i have some goodies…

Best,

Erik

I know how to run pmacctd for a specific interface already by using, e.g.:
interface: green0
in pmacct.conf.

However, I would like to monitor red0 and blue0, too. So according to some hints I’m now using
pcap_interfaces_map: /etc/pmacct/interfaces.map
in pmacct.conf together with this content in above map file:
ifindex=100 ifname=green0 direction=out
ifindex=200 ifname=red0 direction=in
ifindex=300 ifname=blue0 direction=out

I still get some values back into my pipe, however, I do not know how to distinguish those interfaces. It seems if all traffice of all given interfaces are now

I’ve search many ressources in internet even the manual for pmacct, especially https://github.com/pmacct/pmacct/blob/master/CONFIG-KEYS to no avail so far.

So far I’m using the aggregate filters like this one to filter out some unneeded traffic, but could not filter for a specific interface this way:
aggregate_filter[green_full]: src net 192.168.0.0/16 and not dst net 192.168.0.0/16 and not ether multicast and not ip broadcast and ip

Any hints?

Thanks,
Michael

as a really wild guess…

the original table from above was created with:

CREATE TABLE acct (
	mac_src CHAR(17) NOT NULL DEFAULT '0:0:0:0:0:0',
	mac_dst CHAR(17) NOT NULL DEFAULT '0:0:0:0:0:0',
	ip_src CHAR(45) NOT NULL DEFAULT '0.0.0.0',
	ip_dst CHAR(45) NOT NULL DEFAULT '0.0.0.0',
	src_port INT(4) NOT NULL DEFAULT 0,
	dst_port INT(4) NOT NULL DEFAULT 0,
	ip_proto CHAR(6) NOT NULL DEFAULT 0, 
        packets INT NOT NULL,
	bytes BIGINT NOT NULL,
	stamp_inserted DATETIME NOT NULL DEFAULT '0000-00-00 00:00:00',
	stamp_updated DATETIME,
	PRIMARY KEY (mac_src, mac_dst, ip_src, ip_dst, src_port, dst_port, ip_proto, stamp_inserted)

Maybe additional fields and data needs to be collected and placed into the table for the other interface/iface or ifname to work. Like I said, a wild guess.

Hi Jon,

unfortunately I’m not using a database for logging but a memory (pipe). Nevertheless, the fields that I’m collecting/aggregating are similar.

My wild guess :wink: is that I will have to start a different daemon with a different configuration file that monitors one of the other interfaces.

So far I believe I cannot use one daemon to monitor all interfaces at the same time while separating their traffic into several pipes or as in your case, into several tables.

Michael

Hi guys,
sorry for late replay but it is a little stormy here at this time…

you can display the ifindex in the PIPE but you need the configure key for the aggregation in the config (in_iface, out_iface). Also you should then not use one specific interface but the interfaces map in that case.

Example config:

syslog: daemon
promisc: true
!interface: green0
pcap_interfaces_map: /etc/pmacct/pcap_interfaces.map
pcap_ifindex: map

imt_mem_pools_number: 0

plugins: memory[plugin1]

imt_path[plugin1]: /var/spool/pmacct/plugin1.pipe
aggregate[plugin1]: in_iface, out_iface, src_host, dst_host

Example PIPE output could looks like this:

$ pmacct -p /var/spool/pmacct/plugin1.pipe -s
IN_IFACE OUT_IFACE SRC_IP DST_IP PACKETS BYTES
200 0 108.61.201.119 192.168.2.2 14 7685
200 0 192.168.234.2 81.3.27.37 10 854
200 0 192.168.2.1 224.0.0.22 2 144
200 0 192.168.2.1 224.0.0.1 2 72
0 100 192.168.5.2 224.0.0.251 1 119
200 0 99.192.182.100 192.168.2.2 15 7298
200 0 192.168.2.2 23.57.25.13 149 12699

You can also sort e.g. the bytes column via -T bytes e.g.:

pmacct -p /var/spool/pmacct/plugin1.pipe -s -T bytes

as a beneath one.

@jon
If you are only interested in the host used bytes in a summary, you can also use only aggregate[plugin1]: sum_host

I guess I missed this line, 'cause I did the same mapping already, e.g.

ifindex=100 ifname=green0 direction=out
ifindex=200 ifname=red0 direction=in

and neither in_iface nor out_iface have been populated so far.

Other question: Do you know by any chance if the config parameter aggregate_filter[…] can filter upon in_iface or out_iface. I did not find any solution so far. I’ve set up my current filters according to this manual here: https://www.tcpdump.org/manpages/pcap-filter.7.html
OTH, the manual states

ifname interface
True if the packet was logged as coming from the specified interface (applies only to packets logged by OpenBSD’s or FreeBSD’s pf (4)).

So I guess the interface filtering does not work with the current binary of pmacct/d, right?

Some more thoughts: I’ve read somewhere that the memory plugin is not “production grade ready” because it drops some metrics: source

It’s said that the print plugin is more reliable… I’m now testing the print plugin not only because of its said reliability but because I can tell the daemon to call an external program (config parameter: print_trigger_exec) to be run after a certain amount of time. I will use this feature to move the collected data into a InfluxDB similar to the linked source above.

Erik - Do you have an example using sum_host? I know aggregate[plugin1]: sum_host is a line added to pmacct.conf. But then what? How do I access sum_host?

Hi all,

Have tested it yesterday too and have also currently no impact with ‘aggregate_filter’ am currently not sure what´s happening there.

You can execute via ‘print_trigger_exec’ scripts which might be a good way especial for your infrastructure.

a simple example here with a PIPE so you can check it for your needs can be

pmacct.conf:

syslog: daemon

promisc: true
interface: green0

imt_mem_pools_number: 0

plugins: memory[plugin1]

imt_path[plugin1]: /var/spool/pmacct/plugin1.pipe
aggregate[plugin1]: sum_host
you can retstart it via initscript with

/etc/init.d/pmacct restart

and check it then via pmacct client with a

watch pmacct -p /var/spool/pmacct/plugin1.pipe -s -T bytes

which is then also sorted by bytes.

Best,

Erik

2 Likes

Hi,

I need some help with using the config option print_trigger_exec. The trigger should call a Python script to insert the content of the generated CSV-file to a database (InfluxDB).

Here is my configuration file, parts of it:

syslog: daemon
promisc: true

interface: green0

plugins: print[green_full]
print_output_file[green_full]: /root/metrics/traffic_green_full.csv

print_output[green_full]: csv
print_history[green_full]: 1m
print_history_roundoff[green_full]: m

#Execute plugin cache scanner each 60s
print_refresh_time[green_full]: 60

#Execute trigger to insert data into InfluxDB # Command cd is important otherwise Python script throws invisible errors about metrics.conf
print_trigger_exec[green_full]: /usr/bin/python3 /root/metrics/traffic.py -f /root/metrics/traffic_green_full.csv -i green0 -m full

Problem is that this trigger or better the Python script gets not executed! Or at least I cannot see the result in the database. When using the command line that is given above, manually in the IPFire shell, the values are properly inserted into the database.

For debugging, I’ve replaced the above option with the following one and added a CD command to no avail either:

print_trigger_exec[green_full]: cd /root/metrics && /usr/bin/python3 /root/metrics/traffic.py -f /root/metrics/traffic_green_full.csv -i green0 -m full

Next step I tried, use a much more simpler shell-script, test.sh that uses arguments and pass it to a bash-script:

#!/bin/bash
cd /root/metrics/ && /usr/bin/python3 /root/metrics/traffic.py -f $1 -i $2 -m $3

and changed the command line within pmacct.conf

print_trigger_exec[green_full]: /root/metrics/test.sh /root/metrics/traffic_green_full.csv green0 full

Both changes did not work either.
Next step, I changed the content of my test.sh and replaced it with:

#!/bin/bash
echo “test” >> test.log

THIS now works as expected! So right now, I’m both confused and clueless.
Nevertheless while executing parts of the initial command

traffic.py -f /root/metrics/traffic_green_full.csv -i green0 -m full

I once got an error indicating that the logging functions I’ve used inside traffic.py cannot access the necessary logging configuration file: metrics.conf. This file is located in the same folder as the appropriate Python script itself and some other Python scripts can access them. Maybe it is a problem with the daemon pmacctd that runs with different credentials?

More info: I’ve got some more Python scripts within the same folder that are called by cron without any issues. Those scripts, too, use the same logging functiosn and configuration file w/o any problems.

Since no message gets logged neither in /var/log/messages nor elsewhere I could not figure out if this once raised errors still raises and is the cause for no data being inserted into my database.

Is there sthg. I could test?

Michael

Hi Michael,
are you sure that you can execute a set of commands and options via ‘print_trigger_exec’ ? The examples i have found just calls the script. ‘print_trigger_exec’ needs ‘print_refresh_time’ to be executed but you have this in your configuration as far as i can see.

Best,

Erik

THIS could be the cause, your may be right, thanks for this suggestion.

I will give it a try and write different bash-scripts which itself include the parameters and will see what happens.

OTH, do you guess what happens if I use a " at the beginning and at the end to use one single string, similar to this one:

print_trigger_exec[green_full]: “cd /root/metrics && /usr/bin/python3 /root/metrics/traffic.py -f /root/metrics/traffic_green_full.csv -i green0 -m full”

Did not try this, but will definitely check this too.

YES! Erik this was the correct solution! I’ve now coded some bash script that itself call my Python script with arguments and change the mentioned option in pmacct.conf.

Since then, I get my values inserted into my database.

Thanks again,
Michael

Hi all,
there is a new version out --> https://github.com/pmacct/pmacct/releases but am currently not sure which compile time options do you all got. If you are interested, just let it me know. If the old, not solvable problems can be solved with the new version i would make then may a merge request.

Best,

Erik

1 Like

I have pmacct installed and running. I still haven’t found an easy way to get data out of pmacct besides downloading everything and manipulating data within MS Excel.

Anyway - I’d like to see it updated and merged as an approved addon!