Good day,
I would kindly like to know if anyone has experienced an issue whereby the daily graph within the Roadwarrior statistics does not match the frequency of the graph generated on the weekly view?
Good day,
I would kindly like to know if anyone has experienced an issue whereby the daily graph within the Roadwarrior statistics does not match the frequency of the graph generated on the weekly view?
Forgive me for being slow, but I do not understand the problem.
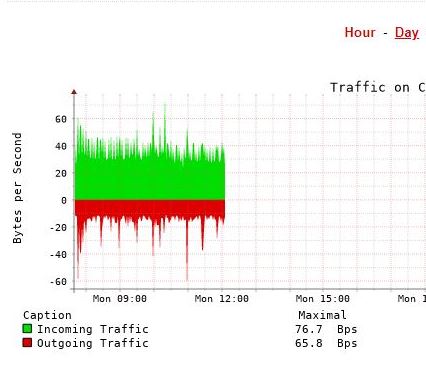
@cfusco , apologies for the confusion. Please note that graph screenshots which I attached are that of the 06th of March 2023.
With that being said, I would like to know why the weekly graph displays a flat line whilst the daily graph displays a more robust graph for the 06th of March 2023.
Hope the above mentioned helps.
I suspect the likelihood is that elsewhere in the week graph there was some traffic at a higher rate for a short period. The graph is auto scaled for all the data in the time period selected.
If the data burst was for a short time you might not even see anything on the graph due to the time resolution.
However you should be able to see the increase in the traffic in the Max value numbers below the graph.
On some of my graphs the total max value goes from 72 Bps to 212 Bps when changing from monthly to yearly.
Your daily graph shows a max value of around 142 Bps. What is the max value combination on your weekly graph? If that is significantly higher then you had a high data burst at some time earlier in that week.