Turned off IPS do to high memory usage.
as per graph on Tuesday evening.
There is a reboot that you can see that happens on Wednesday.
And Memory usage dropped even more.
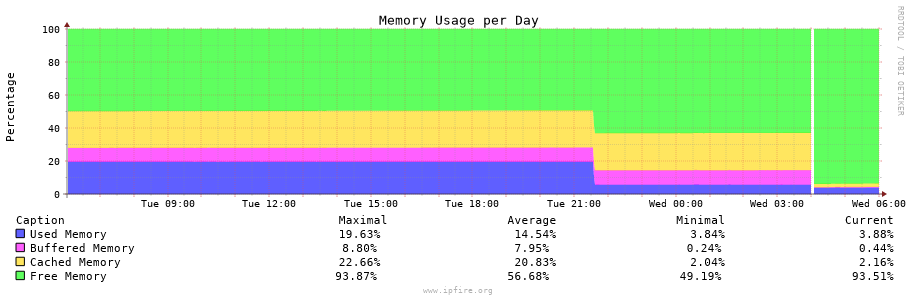
I don’t really see any climbing memory in your chart. It shows running at around 20%.
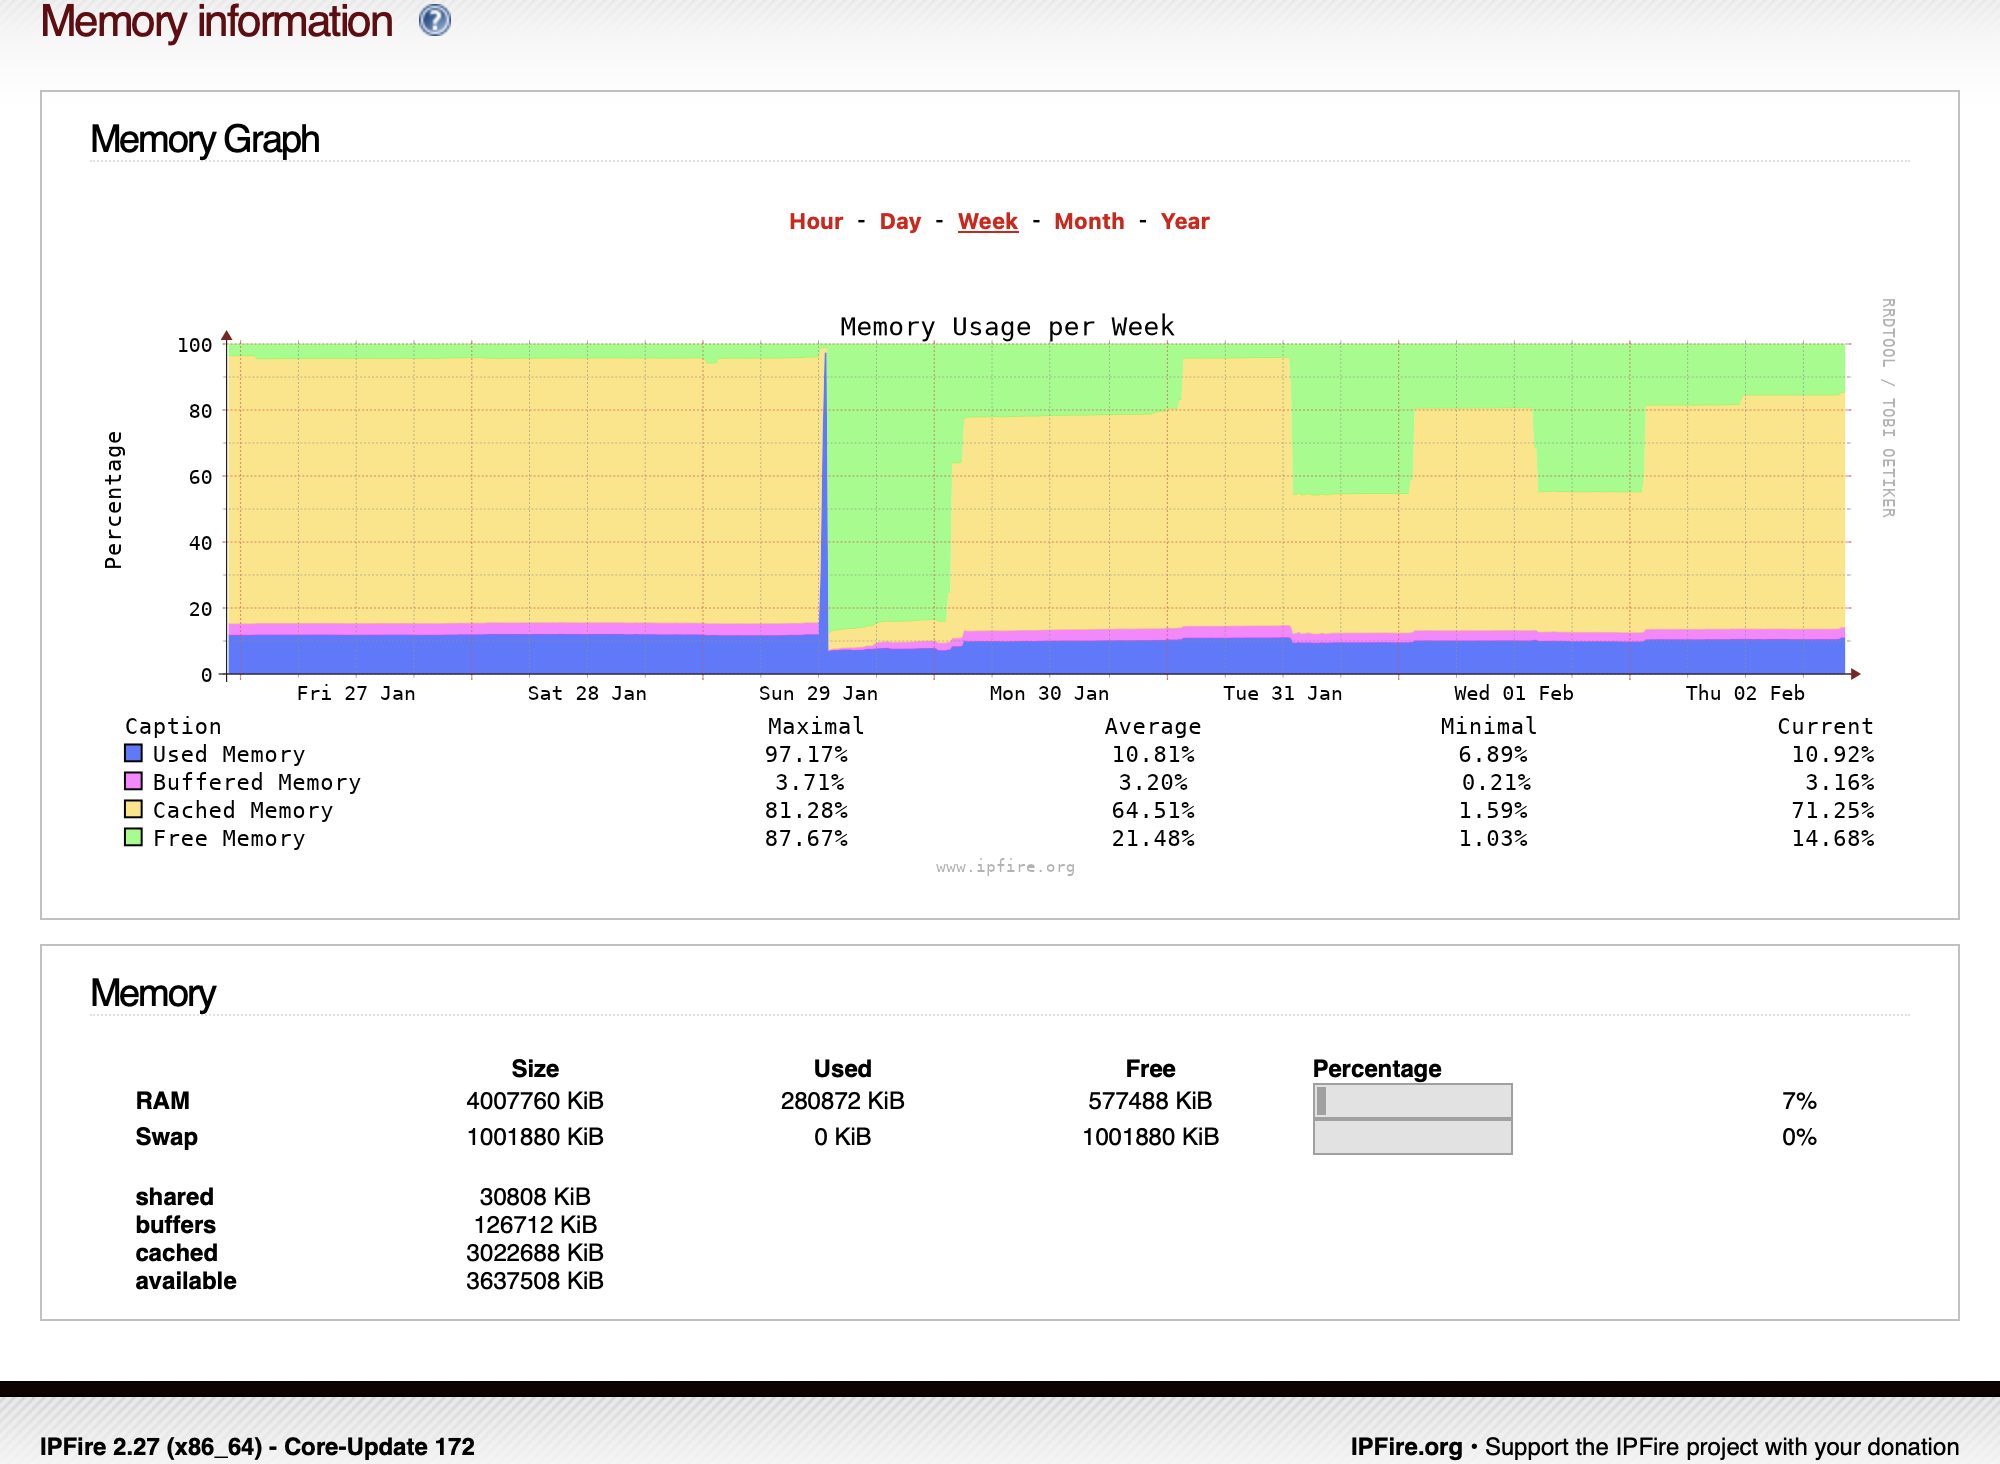
I did see on my system the following.
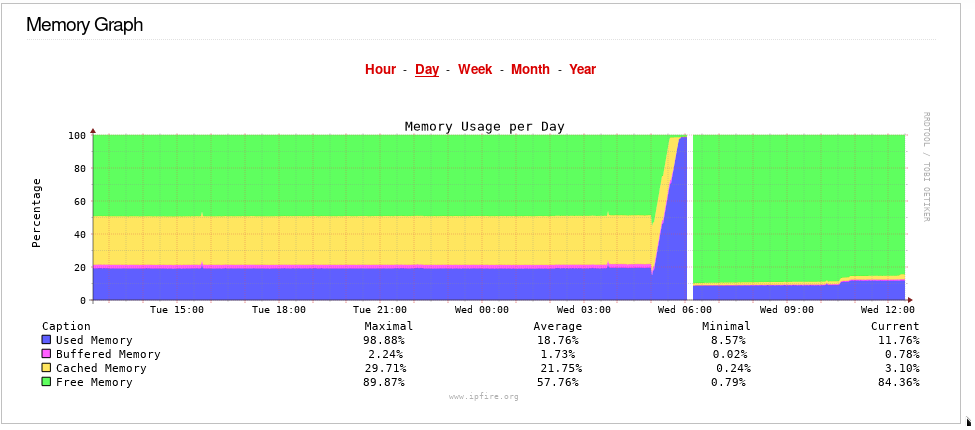
This shows an increase of the actual used memory from 20% to 100%.
Searching through the logs I have tracked this down to starting at 05:00 on Wednesday 1st Feb. There is a reconnect on 1st of each month in the Connection Scheduler page.
This occurred which caused the red connection to stop and reconnect. This red reconnection sometimes causes OpenVPN server to stop for a short period of time and then restart - around 48 seconds on my system.
This stop time is enough to cause the openvpn-authenticator to increase its memory consumption due to bug
https://bugzilla.ipfire.org/show_bug.cgi?id=12963
Once this bug has been triggered then restarting OpenVPN server does not stop the problem.
This continues until memory consumption hit 100% and then started using swap space and then the OOM (Out Of Memory) killer triggered killing the openvpn-authenticator at 06:12 on Wednesday. Then openvpn-authenticator runs fine again because the OpenVPN server is running normally again.
Then collectd fails to collect data for a period of time, presumably due to the effects of the memory consumption and then the OOM killer action. This is the clear space in the memory graph. The system did not reboot during this period.
There are lots of messages in the log from collectd
Filter subsystem: Built-in target
write': Dispatching value to therrdtool’ plugin failed with status -1.
These messages stop after a while and everything goes back to normal with the graphing as OpenVPN is running and so openvpn-authenticator works fine.
This problem will be fixed in CU173 as the patch for bug#12963 has been merged into next.
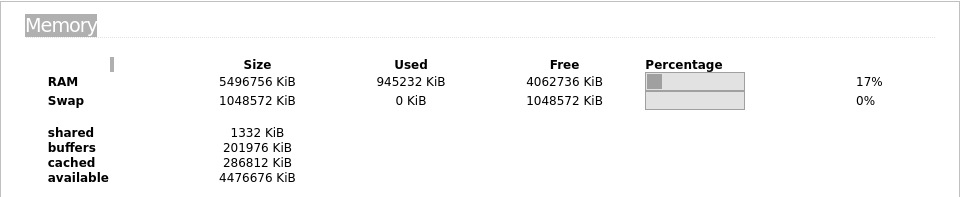
On my system I have the IPS figure at 287576 KB
I also have around 340MB with apcupsd which is making my total Used Memory, the blue region of the graph around 14%
I have 4GB of memory with around 532MB used.
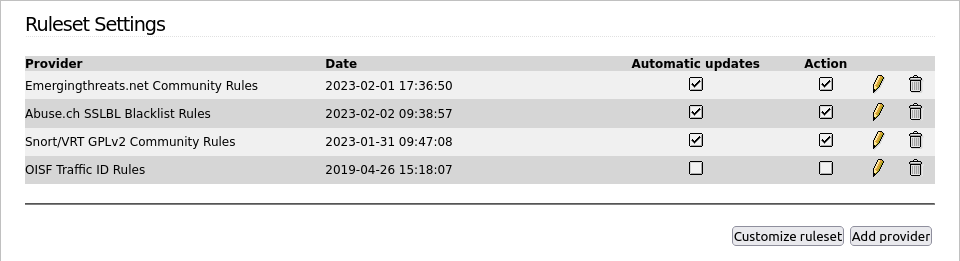
How many rulesets/rules are you using. That probably has an influence on the amount of memory consumed.
I have two providers, Emerging threats and Abuse.ch
The Abuse.ch is just a single ruleset which has been selected with the default rules below that.
From Emerging Threats I have 8 rulesets selected with default rules below that.
I just selected additional rules under my checked rulesets and the IPS memory went up to 404160KB
My blue memory section also goes up and down from around 15% to around 21% and back over a period of a month or so.
The IPS rulesets get updated periodically. Maybe some of the rules get modified over time and that might cause slightly more memory to be used.
Maybe the memory also gets used more if more traffic comes in needing to be scanned?
I don’t see the sort of increase you are seeing as abnormal, I also have a similar status.
Interesting, when I first checked the additional rulesets the Used Memory level first went up by around 8% then went down by around 16% and then, after about 10 mins, it has come back up to where it was originally.
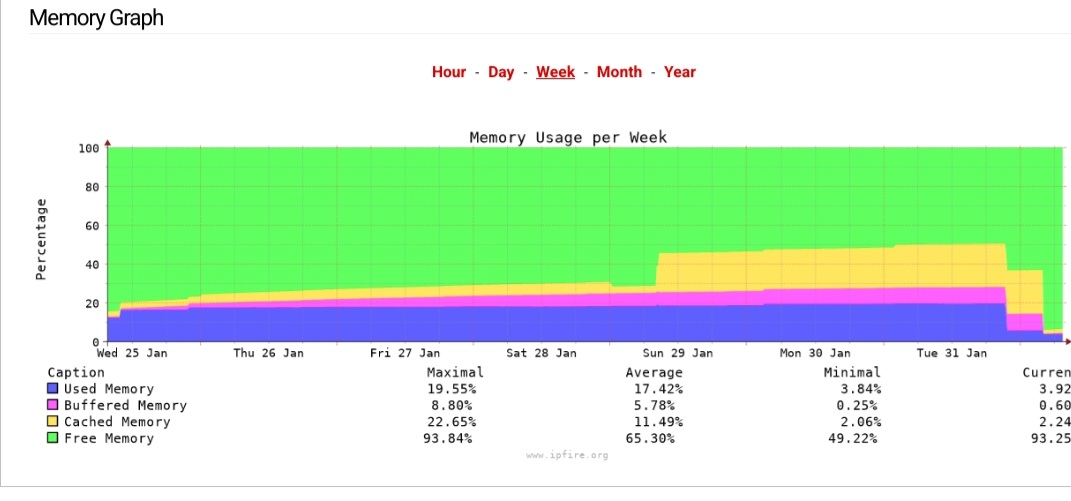
Here is my memory chart over the last year. The first half of the year was some older hardware that then died in beginning of August.
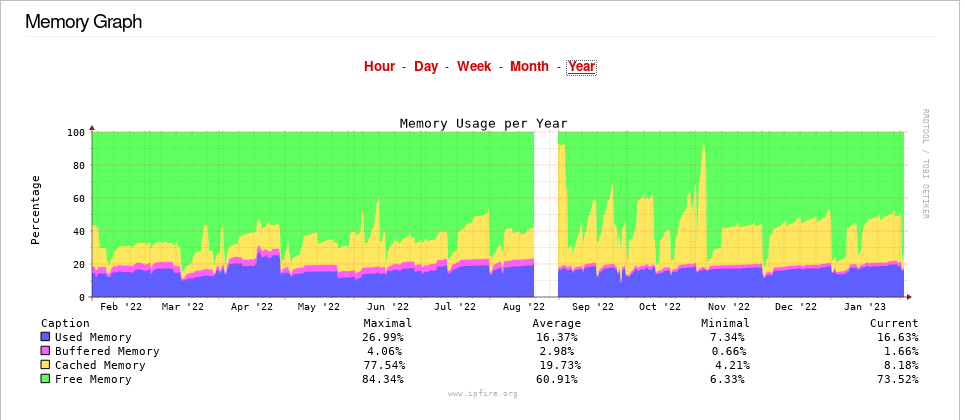
The newer hardware has the Used Memory going up and down but over the 6 month period it’s staying at a similar level, so the ups and downs balance out.
With 8 gig of ram I hope there is a little headroom.
Weekly reboot drops it back down.
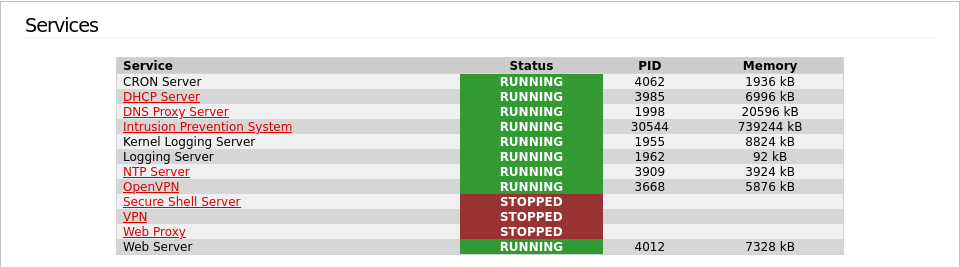
Would be nice to see QoS memory usage on service page.
Not a deal breaker.
IPfire 3 Would be time better spent.
Thanks for your time.
This is the way I look at the Memory Graph:
- Blue = I pay attention to this part of the graph
- Purple = I pay partial attention to this
- Yellow = Informational only (I don’t react to this)
- Green = Informational only (I don’t react to this)
This may help. See:
https://wiki.ipfire.org/configuration/status/services#add-custom-process
Add this to /etc/collectd.custom;
<Plugin processes>
	Process "qosd"
</Plugin>
I have noticed an increase in memory when a strange squid behavior occurs, as reposted in my post.
I still don’t understand why this is happening.