Hi everybody! Been a while since my last contact with the team, so greetings all.
Anyone having problems with the PT attack defense provider selection? (besides the fact of losing access to th webGUI)
So when activated, even in the only monitor mode (or even with all subselections off), youtube videos, access to google’s pages and thunderbird emails are unreachable. In order for me to have normal internet, I need to disable this provider! Which in fact is a bit frustating, I like the defense features this provider provides.
In a future I would like to ask the team as well if in anyway we can add google hacking database as a provider?
Looking forward to get this provider up and running, waiting for replies.
Thanks all.
1 Like
@g70p
Yes, I can duplicate your matter after about 4 hours of option use .
PT Attack Detection Team Rules
For a test I set it to monitor only and I will check logs later .
BR
Trash
My guess is somehow connections aren’t allowed to prevent writitng in the LOG. some zero day suricata spoofing, Ips detection no connection…or just a bug. thanks waiting for results.
PT
G70P
@g70p
Test results:
The list contains too much double space.
And those two rules make the problem, disable them for a test.
APP [PTsecurity] MTproto Telegram pkt chk#0
ATTACK [PTsecurity] Likely OpenSSL TLS renegotiations DoS
My matter at now is, the list auto update, but I had set it to disable auto update.
Then options are active again.
Report the BUG when you get the results.
BR
Trash
##drop tcp $HOME_NET any → $EXTERNAL_NET any (msg: “APP [PTsecurity] MTproto Telegram pkt chk#0”; flow: established, to_server; dsize: 130<>240; content: !“|1603|”; depth: 2; stream_size: server, =, 1; stream_size: server, =, 1; stream_size: client, >,130; stream_size: client, <,300; flowbits: set, FBMproto_0; flowbits: noalert; pcre: “/[\x09-\x0e]/”; reference: url, GitHub - ptresearch/AttackDetection: Attack Detection; metadata: autosign, id_0,; metadata: created_at 2019_02_19, updated_at 2021_03_20; classtype: misc-activity; sid: 11004534; rev: 4;)
##drop tls $EXTERNAL_NET any → $HOME_NET any (msg: “ATTACK [PTsecurity] Likely OpenSSL TLS renegotiations DoS”; flow: to_server, no_stream; content: “|16|”; depth: 1; flowint: tlshandshakecount, +, 1; flowbits: noalert; reference: url, security.360.cn/cve/CVE-2016-6304/; reference: cve, 2016-6304; classtype: attempted-dos; reference: url, GitHub - ptresearch/AttackDetection: Attack Detection; sid: 10000131; rev: 3; )
1 Like
Got it! Give me time to solve. Apparently I need to disable IPS on green. IPS Green OFF. PT attack provider working smothly so far with IPS disabled on green. Wonder if the green interface shouldn’t be on?
~24 hours
PRT
G70P
Thanks for the care and taking the time to help trash, I think I’m ok, so far, with the solution to keep suricata running only on the red interface. After some GUI blocks logging in root/var/ipfire/suricata/settings disabled green with nano.
Still have a lot to ask but for the moment I’m up and running with all available providers and all selections on, on every provider.
I found out to have a martian spoof coming onto my net wich I can see on system logs. But indeed the IPS is running smothly on ipfire.
We’ll meet in some other posts.
The provided text appears to be a Snort rule, which is used for network intrusion detection and prevention. Snort is a popular open-source intrusion detection system (IDS) that allows users to write rules to detect specific network traffic patterns.
Let’s break down the components of the rule:
- Action:
drop- This action instructs Snort to drop (discard) the matching network packets. - Protocol:
tcp- The rule matches TCP packets. - Source and destination IP:
$HOME_NETand$EXTERNAL_NET- These are variables that represent the network ranges defined in Snort’s configuration.$HOME_NETtypically refers to the local network, while$EXTERNAL_NETrepresents external networks. - Message:
“APP [PTsecurity] MTproto Telegram pkt chk#0”- A descriptive message associated with the rule. - Flow:
established, to_server- Matches TCP traffic that is part of an established connection and going from the client to the server. - Data size (dsize):
130<>240- Matches packets with a payload size between 130 and 240 bytes. - Content:
!“|1603|”- Matches packets that do not contain the specific byte sequence1603. - Depth:
2- Snort will only search the first 2 bytes of each packet. - Stream size:
server, =, 1- Matches packets with a server-side stream size of exactly 1 byte. - Stream size:
client, >, 130- Matches packets with a client-side stream size greater than 130 bytes. - Stream size:
client, <, 300- Matches packets with a client-side stream size less than 300 bytes. - Flowbits:
set, FBMproto_0- Sets a flowbit namedFBMproto_0. - Flowbits:
noalert- Prevents alerts from being generated for the matching packets. - PCRE:
/[\x09-\x0e]/- Matches packets that contain any character in the range\x09to\x0e(ASCII characters from tab to newline). - Reference:
url, GitHub - ptresearch/AttackDetection: Attack Detection 1- A reference to an external resource providing more information about the rule. - Metadata:
autosign, id_0- Additional metadata associated with the rule. - Metadata:
created_at 2019_02_19, updated_at 2021_03_20- Creation and update timestamps for the rule. - Classtype:
misc-activity- A classification type for the rule. - SID:
11004534- A unique identifier for the rule. - Rev:
4- The revision number of the rule.
This Snort rule seems to be designed to drop TCP packets that match certain conditions related to the MTproto protocol used by Telegram. It appears to be part of an attack detection mechanism created by PTsecurity.
G70P
@g70p
Many thanks for spending your time in tests.
I understand that remedy, we need solution for the main two bugs.
Please report the bugs you found and your test results to bugzilla.ipfire.org.
-
The Auto Update option, that remain at background updating the PT Attack Detection Team Rules itself after the Auto Update was disabled for this;
and was repeatedly overwrite changes done to file at test, either overwrites to disabled rules points by UI. -
The “too much spaces” in the rule file of PT Attack Detection Team Rules.
-
The two rules who affects the network work and reachability of IPFire.
APP [PTsecurity] MTproto Telegram pkt chk#0
ATTACK [PTsecurity] Likely OpenSSL TLS renegotiations DoS
You can add link to this topic, for further explanation.
Thanks in advance
BR
Trash
Those issues look to be with specific rules from that provider. If that is the case then i would think the bugs should be raised with the provider.
If you deselect the involved rules an update from the provider won’t reselect them.
@bonnietwin
OK I understood.
I cann’t check that before Monday.
If G70P can do and duplicate the matter, he can report the bug.
BR
Trash
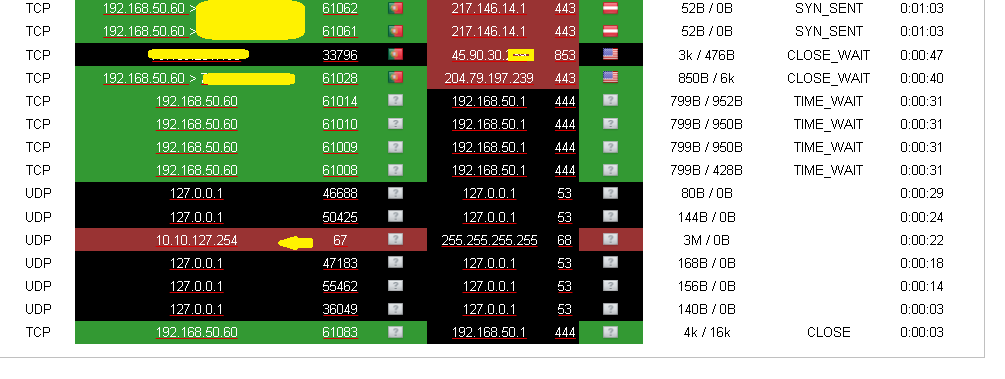
Trash, I see what you mean acttualy I’m not sure if it’s a bug with rule provider itself. The thing is that I have settings being overwritten on my ipfirerouter without my consent too. So the autoupdate might be working normal. I will describe further if you give me time to detect what’s going wrong here. The thing is - what was looking to me a problem with the provider seems to be a problem with persistency on rules I make to the router ipfire. Eg. suricata being disabled; Dns provider with TLS and Qmin (enabled) being disabled; iptable show a Spoofed_Martian not detecting whatsoever is doing (this is a red connection on 67 and 68 ports to the black interface that doesn’t close); System logs tells me memory killer stoped almost all my ipfire settings, but on Gui things still green exept for quikly tests, like dns checks… Wonder if I should open a new thread once this is not related to PTSecurity rather than whatsoever missfailure. Appending log of errors. The violation code shown on the append (ACPI 2700 times) are due to 2 USB not working, they aren’t plugged as well once I’m using fast USB switches in one functrioning USB. That I was expecting. Looking at memory logs with all rule set to on still have 20% of RAM left. Disabled logs on firewall blocks to the martian source and ports 67 and 68 to prevent filling disk with unecessary logs. Blocking there ICMP requests out and in as well PIngs and prtocols like AH GRE IPIP encapsulatedIPV6. Using Next DNS over TLS to contact DNS’s and time system is on ipfire.pool.ntp. I’m not using webproxy neither VPN’s
@trash-trash where are you pulling up the logs above? Bugzilla ok I will ![]() (so much to do)
(so much to do)
@bonnietwin thks ![]()
G70P
append logwatch for 16.6.2023 (using ipfire on an HP Stream 2GBRAM 30Gb disk)
Kernel and Firewall:
WARNING: Out of memory killer killed these executables
Suricata-Main : 2 Time(s)
2 Time(s):
2 Time(s):
2 Time(s): ? filemap_map_pages+0x13c/0x5c0
2 Time(s): __alloc_pages+0x2d5/0x300
2 Time(s): __alloc_pages_slowpath.constprop.0+0xbee/0xd40
2 Time(s): __do_fault+0x33/0x130
2 Time(s): __filemap_get_folio+0x15d/0x350
2 Time(s): __folio_alloc+0x17/0x60
2 Time(s): __handle_mm_fault+0xa79/0x1110
1 Time(s): active_file:249 inactive_file:675 isolated_file:31
1 Time(s): active_file:40 inactive_file:66 isolated_file:20
2 Time(s): asm_exc_page_fault+0x22/0x30
2 Time(s): dump_header+0x4a/0x1b5
2 Time(s): dump_stack_lvl+0x44/0x66
2 Time(s): exc_page_fault+0x1cf/0x7e0
2 Time(s): filemap_fault+0x141/0x940
1 Time(s): free:3817 free_pcp:219 free_cma:0
1 Time(s): free:4164 free_pcp:50 free_cma:0
2 Time(s): handle_mm_fault+0x17d/0x280
2 Time(s): kernel_misc_reclaimable:0
1 Time(s): mapped:1127 shmem:81 pagetables:1476
1 Time(s): mapped:614 shmem:54 pagetables:1422
2 Time(s): oom_kill_process.cold+0xb/0x10
2 Time(s): out_of_memory+0x106/0x2b0
2 Time(s): sec_pagetables:0 bounce:0
1 Time(s): slab_reclaimable:4181 slab_unreclaimable:30928
1 Time(s): slab_reclaimable:5836 slab_unreclaimable:30988
1 Time(s): unevictable:631 dirty:0 writeback:0
1 Time(s): unevictable:631 dirty:9 writeback:0
2 Time(s): 0 pages HighMem/MovableOnly
2 Time(s): 0 pages hwpoisoned
1 Time(s): 1563 pages in swap cache
2 Time(s): 16563 pages reserved
1 Time(s): 206 pages in swap cache
1 Time(s): 3141 total pagecache pages
2 Time(s): 500126 pages RAM
5 Time(s): 8021q: 802.1Q VLAN Support v1.8
1 Time(s): 940 total pagecache pages
2766 Time(s): ACPI Warning: Time parameter 255 us > 100 us violating ACPI spec, please fix the firmware. (20220331/exsystem-141)
1 Time(s): CPU: 0 PID: 4769 Comm: FM#01 Not tainted 6.1.30-ipfire #1
1 Time(s): CPU: 0 PID: 6157 Comm: collectd Not tainted 6.1.30-ipfire #1
2 Time(s): Call Trace:
1 Time(s): Code: 11 03 0f 8a c8 03 00 00 48 c7 43 08 00 00 00 00 48 83 c4 20 5b 5d 41 5c 41 5d 41 5e c3 0f 1f 00 66 0f 2e c0 0f 8a b6 02 00 00 0f 10 07 66 0f 2e c0 0f 8a 38 04 00 00 85 f6 0f 84 00 03 00 00
1 Time(s): Code: Unable to access opcode bytes at 0x5149bd.
1 Time(s): DMA free:7392kB boost:0kB min:64kB low:80kB high:96kB reserved_highatomic:0KB active_anon:0kB inactive_anon:7864kB active_file:0kB inactive_file:0kB unevictable:0kB writepending:0kB present:15928kB managed:15360kB mlocked:0kB bounce:0kB free_pcp:0kB local_pcp:0kB free_cma:0kB
1 Time(s): DMA free:7392kB boost:0kB min:64kB low:80kB high:96kB reserved_highatomic:0KB active_anon:0kB inactive_anon:7952kB active_file:0kB inactive_file:0kB unevictable:0kB writepending:0kB present:15928kB managed:15360kB mlocked:0kB bounce:0kB free_pcp:0kB local_pcp:0kB free_cma:0kB
1 Time(s): DMA32 free:7876kB boost:0kB min:8124kB low:10152kB high:12180kB reserved_highatomic:0KB active_anon:718880kB inactive_anon:1002416kB active_file:0kB inactive_file:328kB unevictable:2524kB writepending:0kB present:1984576kB managed:1918892kB mlocked:2524kB bounce:0kB free_pcp:876kB local_pcp:244kB free_cma:0kB
1 Time(s): DMA32 free:9264kB boost:18268kB min:26392kB low:28420kB high:30448kB reserved_highatomic:0KB active_anon:884892kB inactive_anon:825740kB active_file:544kB inactive_file:3024kB unevictable:2524kB writepending:28kB present:1984576kB managed:1918892kB mlocked:2524kB bounce:0kB free_pcp:196kB local_pcp:0kB free_cma:0kB
1 Time(s): DMA32: 4194kB (UM) 2358kB (UME) 11816kB (UME) 6432kB (UME) 3364kB (UME) 0128kB 0256kB 0512kB 01024kB 02048kB 04096kB = 9604kB
1 Time(s): DMA32: 4314kB (UE) 1288kB (UE) 4116kB (UME) 3332kB (UME) 2464kB (UE) 9128kB (U) 0256kB 1512kB (M) 01024kB 02048kB 04096kB = 7660kB
1 Time(s): DMA: 04kB 28kB (ME) 116kB (U) 232kB (UE) 264kB (UM) 2128kB (UE) 3256kB (UME) 2512kB (UE) 11024kB (E) 22048kB (UE) 04096kB = 7392kB
1 Time(s): DMA: 04kB 48kB (UME) 216kB (UE) 332kB (UME) 364kB (UME) 3128kB (UME) 2256kB (UE) 2512kB (UE) 11024kB (E) 22048kB (UE) 04096kB = 7392kB
1 Time(s): FM#01 invoked oom-killer: gfp_mask=0x140cca(GFP_HIGHUSER_MOVABLE|__GFP_COMP), order=0, oom_score_adj=0
2 Time(s): Free swap = 0kB
2 Time(s): Hardware name: HP HP Stream Laptop 14-ax0XX/82BD, BIOS F.08 12/05/2016
2 Time(s): IPv4: martian source 169.254.255.59 from 169.254.255.59, on dev green0
14 Time(s): IPv4: martian source 255.255.255.255 from 10.10.127.254, on dev red0
5 Time(s): Kernel log daemon terminating.
5 Time(s): Kernel logging (proc) stopped.
2 Time(s): Mem-Info:
1 Time(s): Node 0 active_anon:718880kB inactive_anon:1010368kB active_file:160kB inactive_file:264kB unevictable:2524kB isolated(anon):0kB isolated(file):80kB mapped:2456kB dirty:0kB writeback:0kB shmem:216kB shmem_thp: 0kB shmem_pmdmapped: 0kB anon_thp: 888832kB writeback_tmp:0kB kernel_stack:2064kB pagetables:5688kB sec_pagetables:0kB all_unreclaimable? no
1 Time(s): Node 0 active_anon:885060kB inactive_anon:833460kB active_file:996kB inactive_file:2700kB unevictable:2524kB isolated(anon):0kB isolated(file):124kB mapped:4508kB dirty:36kB writeback:0kB shmem:324kB shmem_thp: 0kB shmem_pmdmapped: 0kB anon_thp: 854016kB writeback_tmp:0kB kernel_stack:2208kB pagetables:5904kB sec_pagetables:0kB all_unreclaimable? no
1 Time(s): R10: 0000000000000000 R11: 0000000000000002 R12: 0000000000000002
1 Time(s): R10: 0000000000000000 R11: 000000000000502a R12: 0000000000000000
1 Time(s): R13: 0000000000000000 R14: 0000000000000001 R15: 000000000000000b
1 Time(s): R13: 0000000000000000 R14: 000000000000004b R15: 00007b6ee4000b70
1 Time(s): RAX: 0000000000000000 RBX: 00000000015a58c0 RCX: 0000000000000011
1 Time(s): RAX: 000000000000000b RBX: 000076c9ea9b2048 RCX: 0000000000000001
1 Time(s): RBP: 0000000000000000 R08: 0000000000000011 R09: 0000000000000000
1 Time(s): RBP: 000076c9e40b93a8 R08: 000000000000002b R09: 000000000000004a
1 Time(s): RDX: 0000000000000000 RSI: 0000000000000002 RDI: 000076c9ea9b2048
1 Time(s): RDX: 0000000000000000 RSI: 00007b6ee42750a0 RDI: 00000000015a58c0
1 Time(s): RIP: 0033:0x5149e7
1 Time(s): RIP: 0033:0x76c9ece5ff9a
1 Time(s): RSP: 002b:000076c9eb9fd950 EFLAGS: 00010242
1 Time(s): RSP: 002b:00007b6eeecb6b28 EFLAGS: 00010206
2 Time(s): Tasks state (memory values in pages):
2 Time(s): Total swap = 483560kB
1 Time(s): [ 638] 0 638 4838 295 53248 262 -1000 udevd
1 Time(s): [ 641] 0 641 4829 429 57344 246 -1000 udevd
1 Time(s): [ 3847] 0 3847 1280 129 49152 61 0 vnstatd
1 Time(s): [ 3852] 0 3852 1280 133 49152 46 0 vnstatd
1 Time(s): [ 3858] 0 3858 2266 335 57344 1672 0 klogd
1 Time(s): [ 3863] 0 3863 2267 271 49152 1669 0 klogd
1 Time(s): [ 3865] 0 3865 627 386 45056 14 0 syslogd
1 Time(s): [ 3870] 0 3870 627 338 40960 15 0 syslogd
1 Time(s): [ 3884] 0 3884 637 608 45056 0 -1000 watchdog
1 Time(s): [ 3890] 0 3890 637 608 49152 0 -1000 watchdog
1 Time(s): [ 3910] 99 3910 5646 803 81920 2442 0 unbound
1 Time(s): [ 3916] 99 3916 5766 1280 86016 2178 0 unbound
1 Time(s): [ 3921] 0 3921 634 0 45056 37 0 acpid
1 Time(s): [ 3927] 0 3927 634 379 45056 37 0 acpid
1 Time(s): [ 4041] 52 4041 760 385 45056 78 0 dhcpcd
1 Time(s): [ 4042] 0 4042 749 357 45056 84 0 dhcpcd
1 Time(s): [ 4043] 52 4043 712 9 45056 65 0 dhcpcd
1 Time(s): [ 4109] 52 4109 746 9 45056 84 0 dhcpcd
1 Time(s): [ 4166] 0 4166 723 0 49152 33 0 saslauthd
1 Time(s): [ 4167] 0 4167 723 0 49152 33 0 saslauthd
1 Time(s): [ 4191] 0 4191 19147 394 61440 199 0 ntpd
1 Time(s): [ 4244] 0 4244 59558 763 102400 154 0 collectd
1 Time(s): [ 4271] 0 4271 2191 678 57344 311 0 dhcpd
1 Time(s): [ 4283] 0 4283 4318 670 73728 1622 0 unbound-dhcp-le
1 Time(s): [ 4298] 0 4298 3510 429 69632 273 0 httpd
1 Time(s): [ 4299] 99 4299 3299 480 57344 300 0 httpd
1 Time(s): [ 4303] 99 4303 286219 1161 212992 333 0 httpd
1 Time(s): [ 4348] 0 4348 905 432 49152 32 0 fcron
1 Time(s): [ 4377] 0 4377 64006 5827 131072 1196 0 guardian
1 Time(s): [ 4384] 0 4384 756 432 49152 69 0 agetty
1 Time(s): [ 4385] 0 4385 756 435 40960 70 0 agetty
1 Time(s): [ 4386] 0 4386 756 435 45056 70 0 agetty
1 Time(s): [ 4387] 0 4387 756 448 45056 69 0 agetty
1 Time(s): [ 4388] 0 4388 756 448 40960 69 0 agetty
1 Time(s): [ 4389] 0 4389 756 447 45056 70 0 agetty
1 Time(s): [ 4751] 101 4751 435031 247084 3026944 111647 0 Suricata-Main
1 Time(s): [ 5591] 101 5591 425982 239887 2945024 109742 0 Suricata-Main
1 Time(s): [ 5936] 52 5936 749 12 45056 84 0 dhcpcd
1 Time(s): [ 6018] 0 6018 723 3 45056 27 0 saslauthd
1 Time(s): [ 6019] 0 6019 723 4 45056 27 0 saslauthd
1 Time(s): [ 6102] 0 6102 19141 296 65536 205 0 ntpd
1 Time(s): [ 6155] 0 6155 59628 1257 102400 169 0 collectd
1 Time(s): [ 6181] 0 6181 2191 349 61440 856 0 dhcpd
1 Time(s): [ 6192] 0 6192 4313 363 77824 2044 0 unbound-dhcp-le
1 Time(s): [ 6208] 0 6208 3510 490 69632 254 0 httpd
1 Time(s): [ 6210] 99 6210 3299 510 57344 287 0 httpd
1 Time(s): [ 6212] 99 6212 286185 1955 204800 335 0 httpd
1 Time(s): [ 6258] 0 6258 905 441 45056 26 0 fcron
1 Time(s): [ 6272] 0 6272 64005 5349 122880 1679 0 guardian
1 Time(s): [ 6276] 0 6276 756 469 45056 68 0 agetty
1 Time(s): [ 6277] 0 6277 756 469 45056 69 0 agetty
1 Time(s): [ 6278] 0 6278 756 435 45056 69 0 agetty
1 Time(s): [ 6279] 0 6279 756 432 45056 69 0 agetty
1 Time(s): [ 6280] 0 6280 756 434 40960 68 0 agetty
1 Time(s): [ 6281] 0 6281 756 428 53248 68 0 agetty
1 Time(s): [ 9400] 0 9400 905 8 45056 41 0 fcron
1 Time(s): [ 9401] 0 9401 1088 402 49152 67 0 bash
1 Time(s): [ 9402] 0 9402 7240 4408 90112 416 0 update-ipblockl
1 Time(s): [ 9957] 99 9957 176830 174436 1462272 0 0 ids.cgi
1 Time(s): [ 9969] 99 9969 841 307 45056 0 0 gzip
1 Time(s): [ 10799] 99 10799 178304 175651 1478656 0 0 ids.cgi
1 Time(s): [ 10810] 99 10810 841 220 45056 0 0 gzip
2 Time(s): [ pid ] uid tgid total_vm rss pgtables_bytes swapents oom_score_adj name
1 Time(s): active_anon:179720 inactive_anon:252592 isolated_anon:0
1 Time(s): active_anon:221265 inactive_anon:208365 isolated_anon:0
1 Time(s): collectd invoked oom-killer: gfp_mask=0x140cca(GFP_HIGHUSER_MOVABLE|__GFP_COMP), order=0, oom_score_adj=0
14 Time(s): ll header: 00000000: ff ff ff ff ff ff 00 27 90 0d c4 19 08 00
2 Time(s): ll header: 00000000: ff ff ff ff ff ff 40 b0 34 53 0e 2f 08 06
2 Time(s): lowmem_reserve[]: 0 0 0 0
2 Time(s): lowmem_reserve[]: 0 1832 1832 1832
1 Time(s): oom-kill:constraint=CONSTRAINT_NONE,nodemask=(null),cpuset=/,mems_allowed=0,global_oom,task_memcg=/,task=Suricata-Main,pid=4751,uid=101
1 Time(s): oom-kill:constraint=CONSTRAINT_NONE,nodemask=(null),cpuset=/,mems_allowed=0,global_oom,task_memcg=/,task=Suricata-Main,pid=5591,uid=101
1 Time(s): perf: interrupt took too long (2507 > 2500), lowering kernel.perf_event_max_sample_rate to 79000
2 Time(s): perf: interrupt took too long (2510 > 2500), lowering kernel.perf_event_max_sample_rate to 79000
1 Time(s): perf: interrupt took too long (2526 > 2500), lowering kernel.perf_event_max_sample_rate to 79000
2 Time(s): perf: interrupt took too long (3141 > 3137), lowering kernel.perf_event_max_sample_rate to 63000
1 Time(s): perf: interrupt took too long (3164 > 3157), lowering kernel.perf_event_max_sample_rate to 63000
1 Time(s): perf: interrupt took too long (3173 > 3133), lowering kernel.perf_event_max_sample_rate to 63000
1 Time(s): perf: interrupt took too long (3930 > 3926), lowering kernel.perf_event_max_sample_rate to 50000
1 Time(s): perf: interrupt took too long (3935 > 3926), lowering kernel.perf_event_max_sample_rate to 50000
1 Time(s): perf: interrupt took too long (3963 > 3955), lowering kernel.perf_event_max_sample_rate to 50000
1 Time(s): perf: interrupt took too long (3984 > 3966), lowering kernel.perf_event_max_sample_rate to 50000
1 Time(s): perf: interrupt took too long (4917 > 4912), lowering kernel.perf_event_max_sample_rate to 40000
1 Time(s): perf: interrupt took too long (4930 > 4918), lowering kernel.perf_event_max_sample_rate to 40000
1 Time(s): perf: interrupt took too long (7758 > 7757), lowering kernel.perf_event_max_sample_rate to 25000
3 Time(s): r8152 1-5.1:1.0 red0: carrier off
3 Time(s): r8152 1-5.1:1.0 red0: carrier on
3 Time(s): r8152 1-5.3:1.0 green0: carrier off
8 Time(s): r8152 1-5.3:1.0 green0: carrier on
@g70p
I understand matter, so I will check tomorrow at my IPFire.
For your claim about Bogon:
You cannot use Bogon list, if your IPFire have an Bogon IP at eth red.
By my tests to Bogon and also at the time I used ipfblocklist, I had to whitelist all my local devices at eth red side, because I have some devices at Router.
So I added Router IP, DNS IP, NAS IP where I pull my private Blocklists and red eth IP to the Whitelist.
The question you need to think about, what Bogon IPs you are using at your network?
Bogon at internal network as at green and blue, should not be affected by IDS.
Otherways you need add them to Whitelist too, as ex. 192.168.0.0/24 … but I hadn’t recognize such an matter before. I test that at Monday.
Added note:
If I do need to add green and blue to Whitelist because of Bogon reports, then I do not need IDS at green and blue, because that will no further make sense of use.
BR
Trash
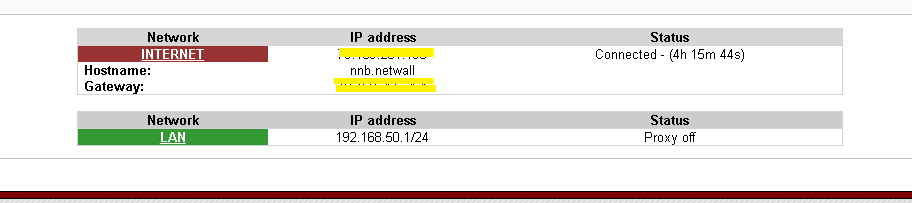
@trash-trash the source of the bogon is from the ISP router. I admit some knowledge limitations here but I’m wondering about whitelisting this conection to ipfire
and it’s bridged on the router specific port 4 for bridges. I haven’t got any other device connected on ISP Router/Modem
whitelist 10.10.127.254 ?
G70P
Edit: No other device is connected to Router/Modem - wifi 2.4G/5G and guest wifi are all disabled. Included DHCP at the ISP RouterModem is disabled with static IP 174.20.1.1. (edit) I had but disconnected a while a go (over a week).
Connection is as simple as possible to avoid mistakes. PC-USB-ipfire-USB-modem (bridge4)-coaxial cable-ISP
@g70p
OMG
OK you blacken soot the IPs, this gets difficult.
No do not whitelist, that is not the solution.
OK that info to your Modem, was eddited by you later.
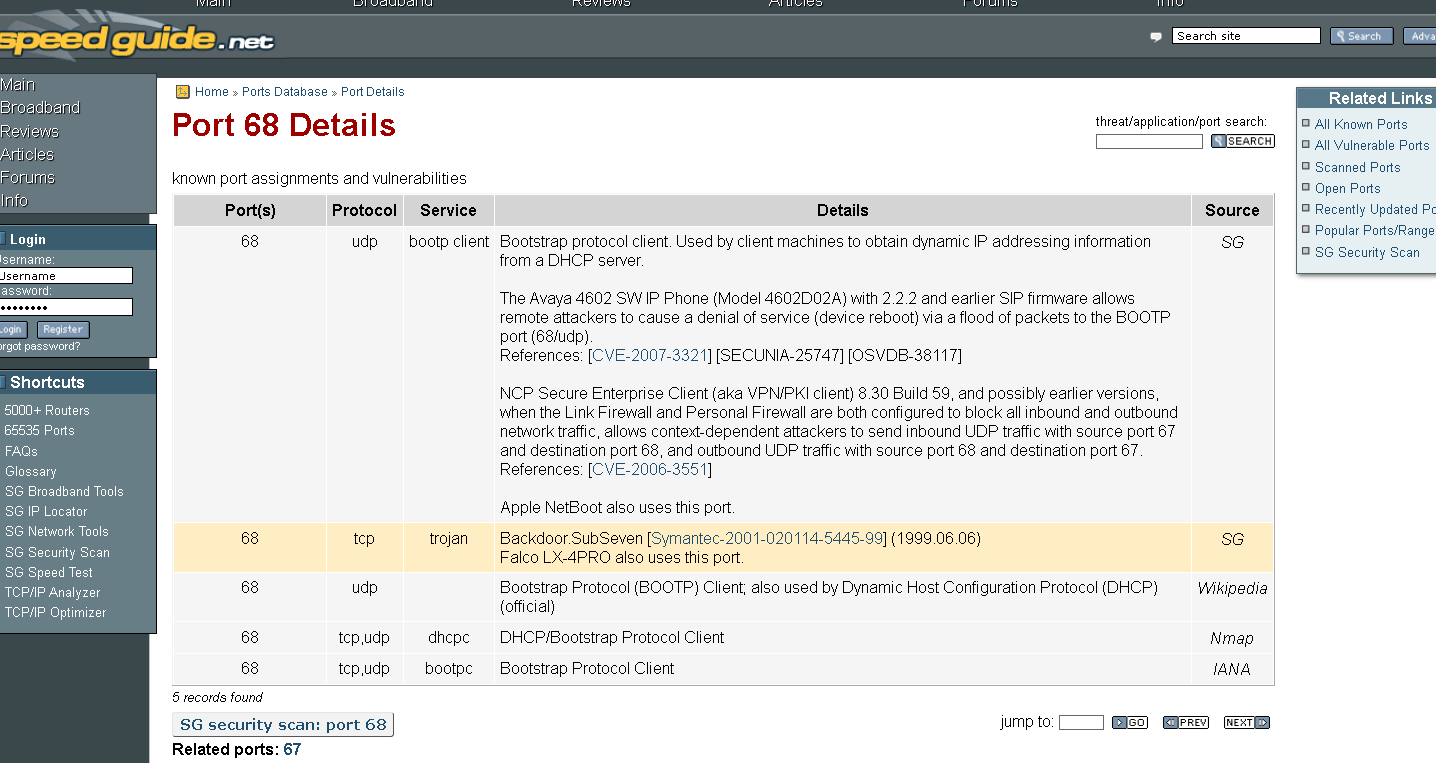
wiki network ports
67 – UDP Bootstrap Protocol (BOOTP) Server; also used for DHCP offiziell
68 – UDP Bootstrap Protocol (BOOTP) Client; also used for DHCP offiziell
How do you configure the Modem?
You use the Bogon IP to get to Web-Interface. Right?
The DHCP there is still enabled?
BR
Trash
You use the Bogon IP to get to Web-Interface. Right?
No
Your ISP deliver an UMTS/LTE connection by an 4G?? Modem?
Don’t know, it’s the equipment instaled by default!
disable Bogon filter at IDS
I will give time to tests
OK that info to your Modem, was eddited by you later.
Sorry my fault, information was missing.
How do you configure the Modem? You use the Bogon IP to get to Web-Interface. Right?
No as said before. The configs are made throught an app on the cellphone (not connected directly - i use mobile internet/not wifi). Can’t cable connect to the modem with coaxial cable off. If it’s possible still haven’t figured it out. Once in the app I configure the router inside as explained above, and where I turn on bridge mode on 4 and disable wifi’s and internal dhcp.
G70P
I addited my last post, you can look at my thought and changes.
At now I understand, that you use a Modem in Bridge.
But locally the Modem have an Bogon IP and seems the DHCP is active.
The IP you see is the one of the Modem. Please check that by IP.
Else I see no affects.
Bad to work at an small display.
Tomorrow I will do test the other point to this topic.
BR
Trash
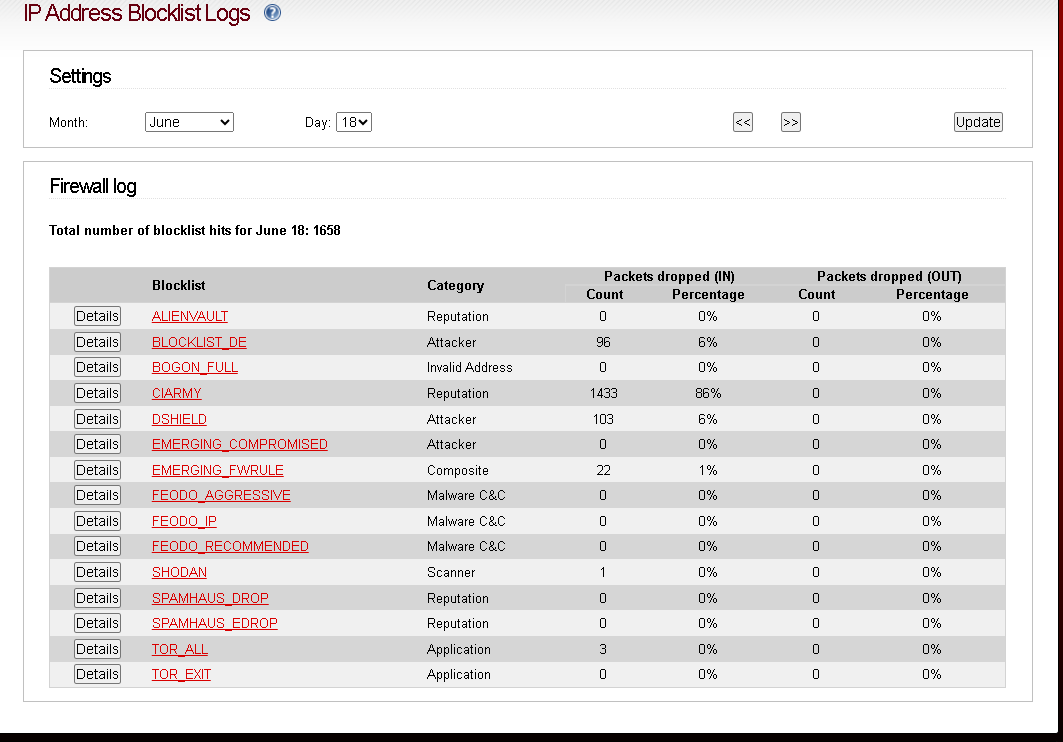
![]() I’m afraid that BOGON to be a MITM and I don’t know how to kill that conection! Actually the kernel and firewall bugs might happen to make this connections. Either that or I have some external RFCID antena bugging electronics to deliver bad connections and memmory RAM gear bugs. It’s just not normal. I apreciate your time and effort. I have been doing this since this morning and a bit tired. I’m reading the BOGUS Thread and disabling unecessary lists (so far I see 2 as invalid adresses) . The IP blocked in my later post is my public IP wich I try to keep safe to avoid nmaps. Altough it’s a multicast ip, chages every 24 hours I believe.
I’m afraid that BOGON to be a MITM and I don’t know how to kill that conection! Actually the kernel and firewall bugs might happen to make this connections. Either that or I have some external RFCID antena bugging electronics to deliver bad connections and memmory RAM gear bugs. It’s just not normal. I apreciate your time and effort. I have been doing this since this morning and a bit tired. I’m reading the BOGUS Thread and disabling unecessary lists (so far I see 2 as invalid adresses) . The IP blocked in my later post is my public IP wich I try to keep safe to avoid nmaps. Altough it’s a multicast ip, chages every 24 hours I believe.
G70P
Regards
Report of adresses blocklist I’m disabling invalid adresses)
Hi, I contacted my internet service provider to understand the origin of this connection to #10.10.127.254, and they explained to me that it is their router support service. In case of service failure or configuration needs, this is the remote management. I must admit that it made me feel more at ease, although it doesn’t seem right to me for this connection to never close without seeking technical support from the ISP. Well…
@g70p
During my test, inputs via console were later overwritten.
After script checking, this is normal, because the changes in the course of the test did not match the UI.
Even if Autoupdate is disabled, starting and stopping the application is enough to overwrite it.
All good, the only thing that remains is the thing with the Filter Maintainer.
I try contact and report those two points:
-
The “too much spaces” in the rule file of PT Attack Detection Team Rules.
-
The two rules who affects the network work and reachability of IPFire.
APP [PTsecurity] MTproto Telegram pkt chk#0
ATTACK [PTsecurity] Likely OpenSSL TLS renegotiations DoS
BR
Trash
1 Like
Ok, explain me what tests would you like me run. I suppose I’m in a security lane for the moment, as I needed to test DNS servers on ISP side. Apparently I was having a swich or a bad cache between modem and ISP. I changed to DOH with forward to DNS servers on firewall and setting up a DNS forward on the ipfirewall page. Still blocking 53 ports and unused protocols as pings, telnet and ssh’s.
Meanwhile I turned on suricata on green and had to disable ET policy about bad internal connections, Still PT security remains on monitor, only this way or I’ll lose access to GUI again once I couldn’t setup a forward between LAN and port 444 on ipfire administration. So again what tests would you like me to perform?
Regards
G70P
During my test, inputs via console were later overwritten.
After script checking, this is normal, because the changes in the course of the test did not match the UI.
Even if Autoupdate is disabled, starting and stopping the application is enough to overwrite it.
found this ![]()
“These tools support specific command arguments that enable the operators to delete logs, modify existing logs, or add new logs to the system.” Bleepingcomputer (21.06.2023); Hackers infect Linux SSH servers with Tsunami botnet malware
I’m thinking that my AV home solution might be interfering with suricata on green making a map mess when trying to reach the firewall interface. Wondering if BD also uses suricata so that would make 3 suricatas running ![]()
Regards
G70P