IPS: Customize actions taken

Hi everone!
I am new to IPfire. Used to run IPcop starting already with a 0.x version back then. Switched to pfSense for several years now and want to give IPfire a try.

Installation and general config including server in DMZ, DHCP, DNS etc are really simple and all worked like a charm (HW: PC engines APU2).

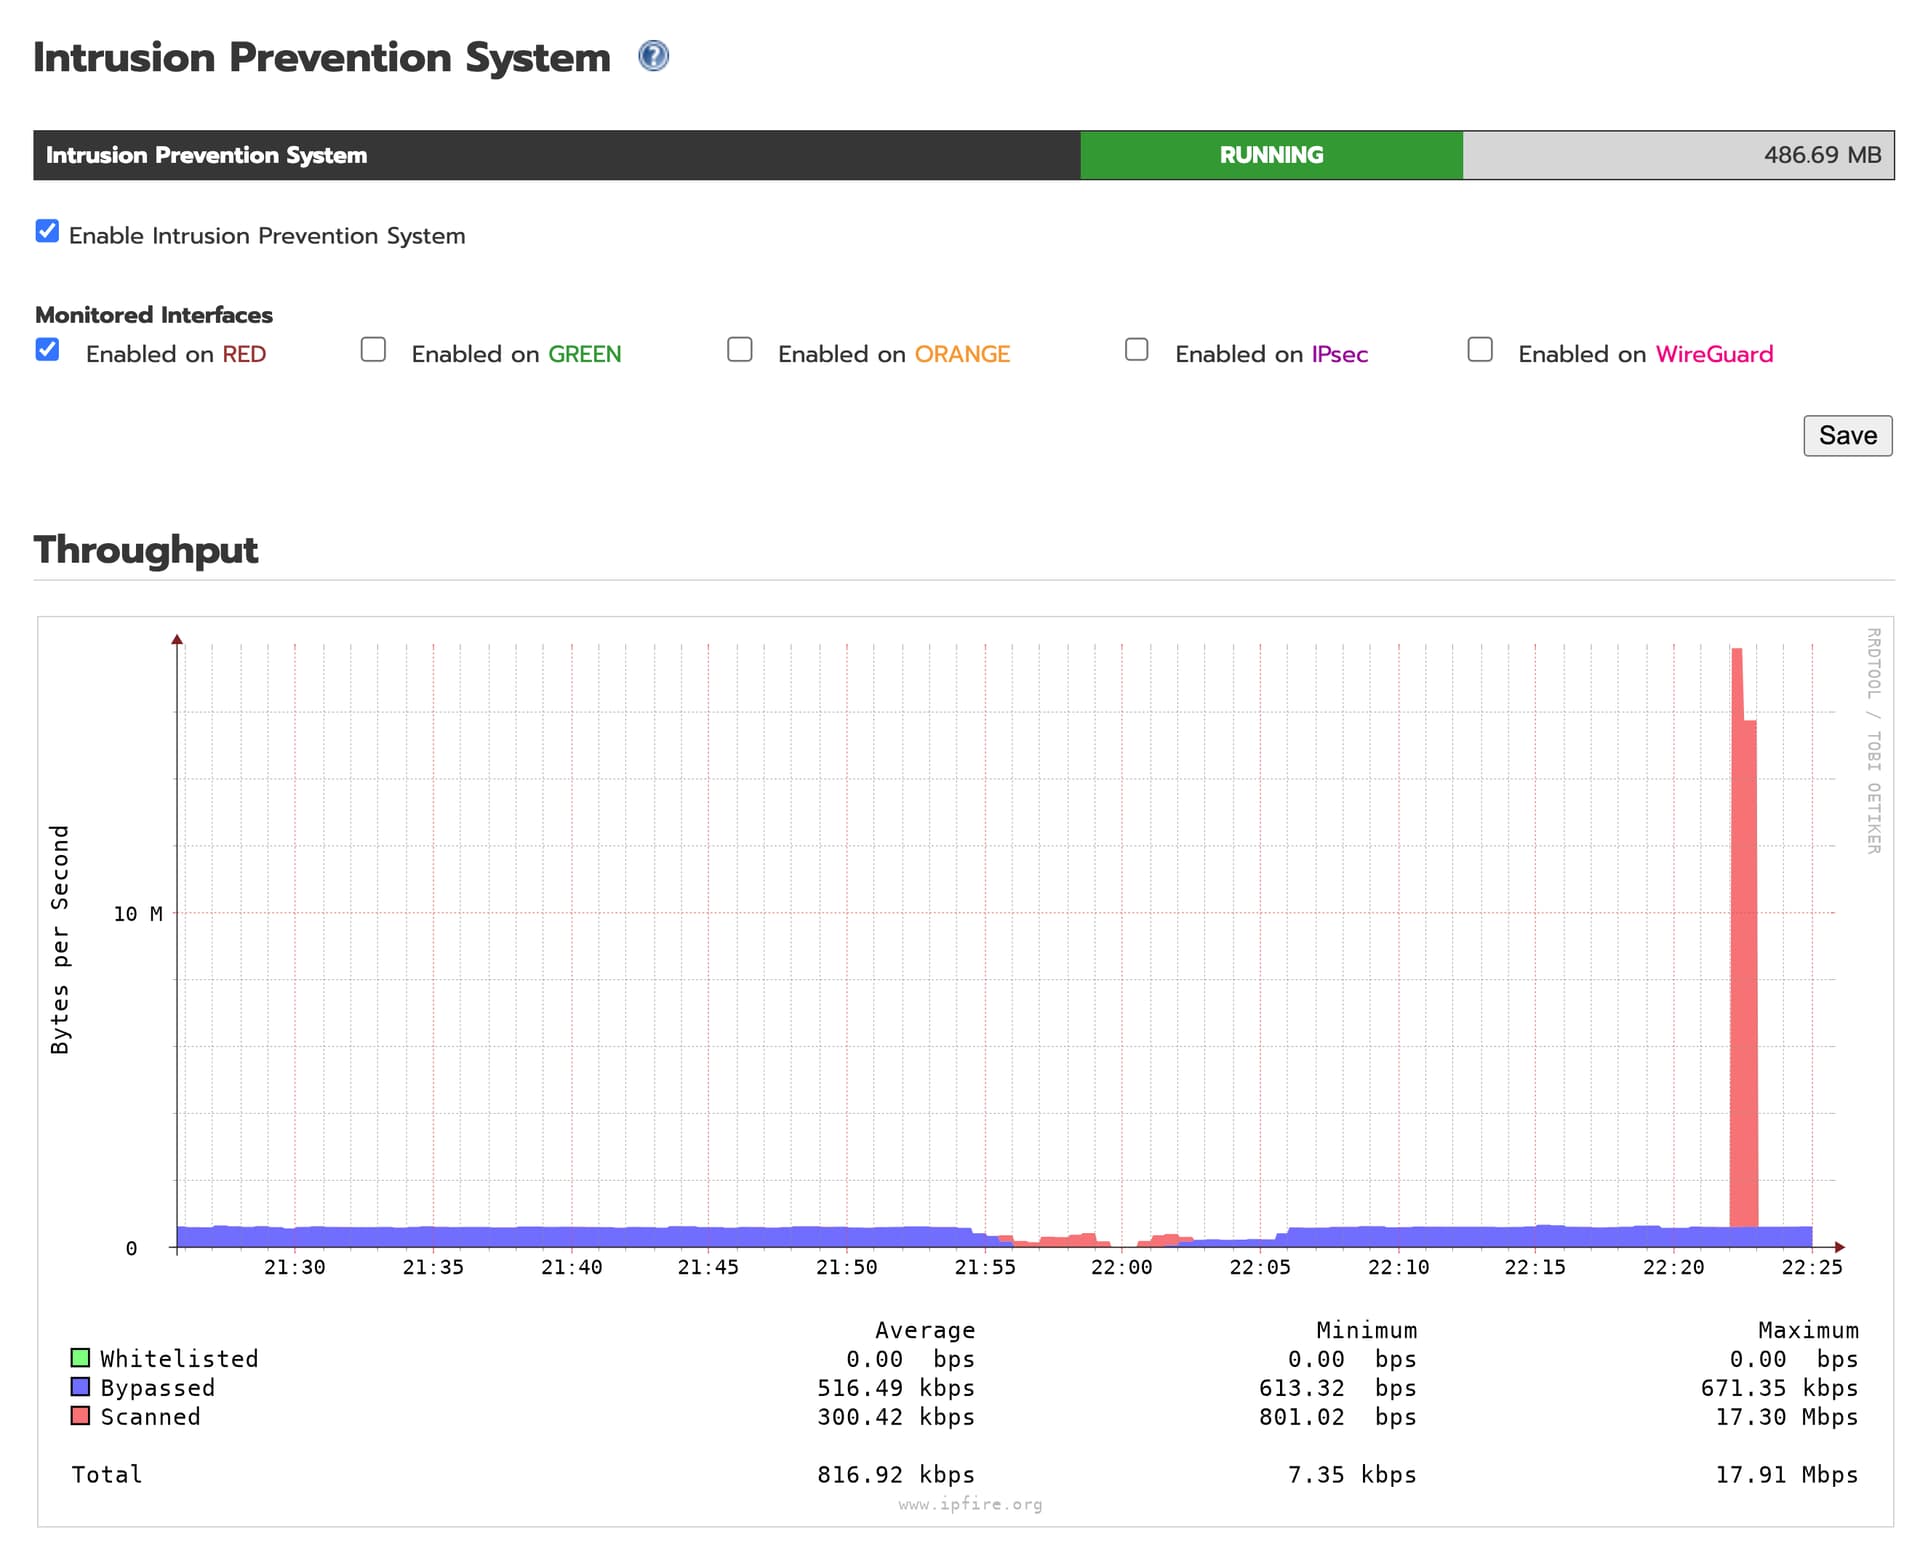
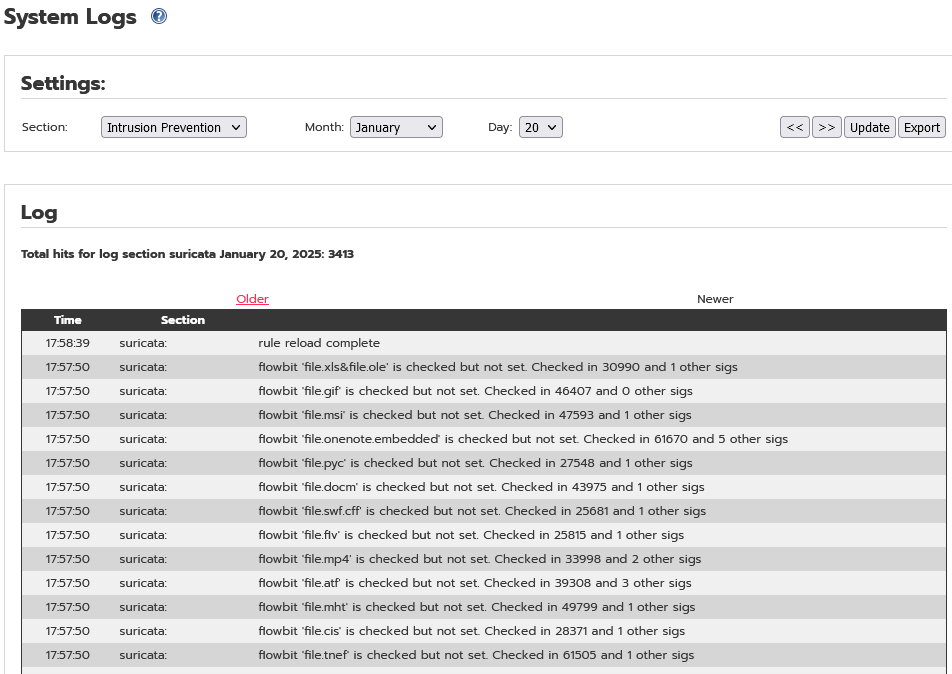
As I used to run Snort on the pfSense previously I have now set up IPS and here it says the intrusion detection is implemented using Suricata.
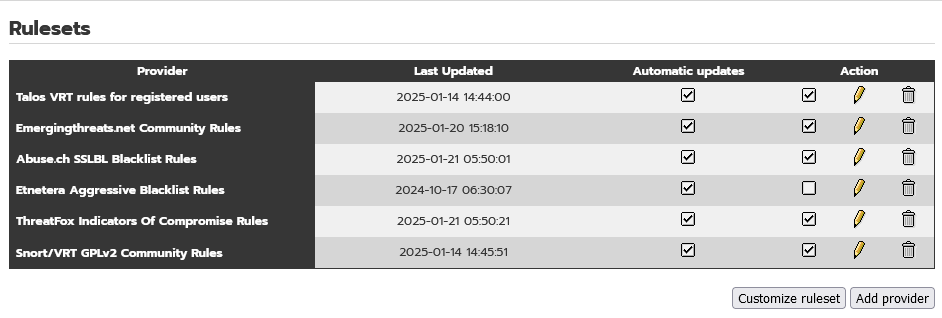
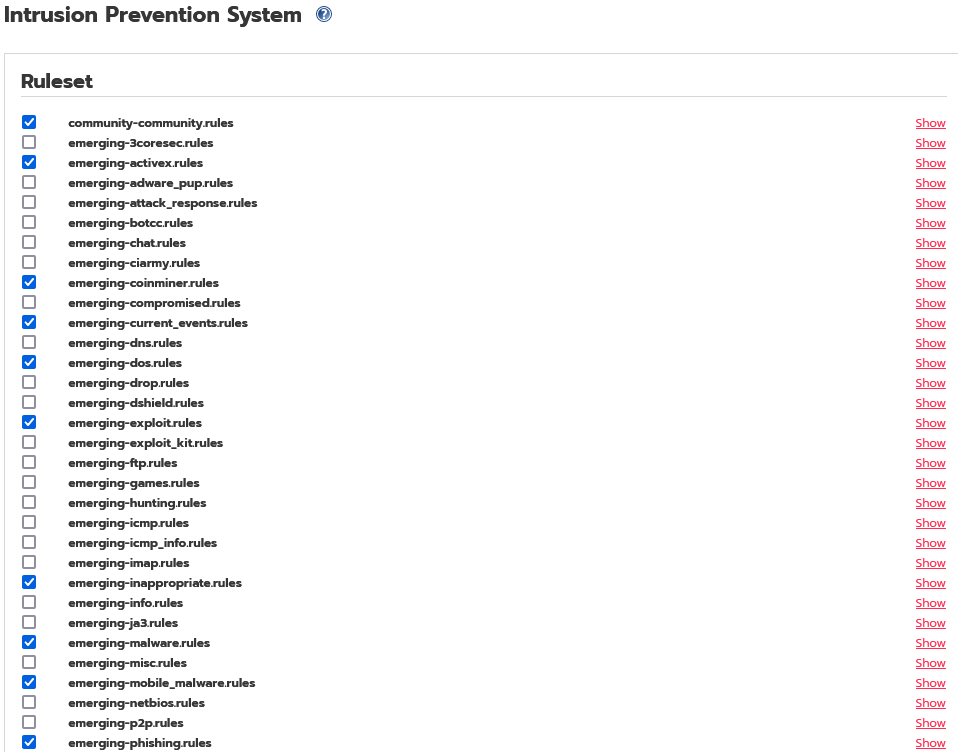
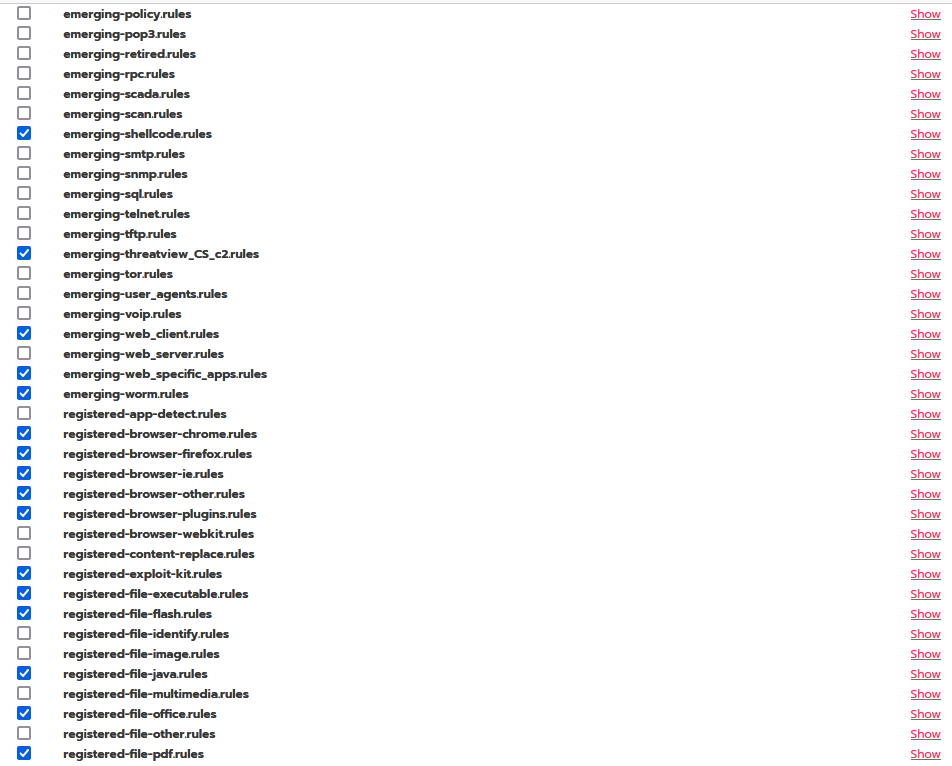
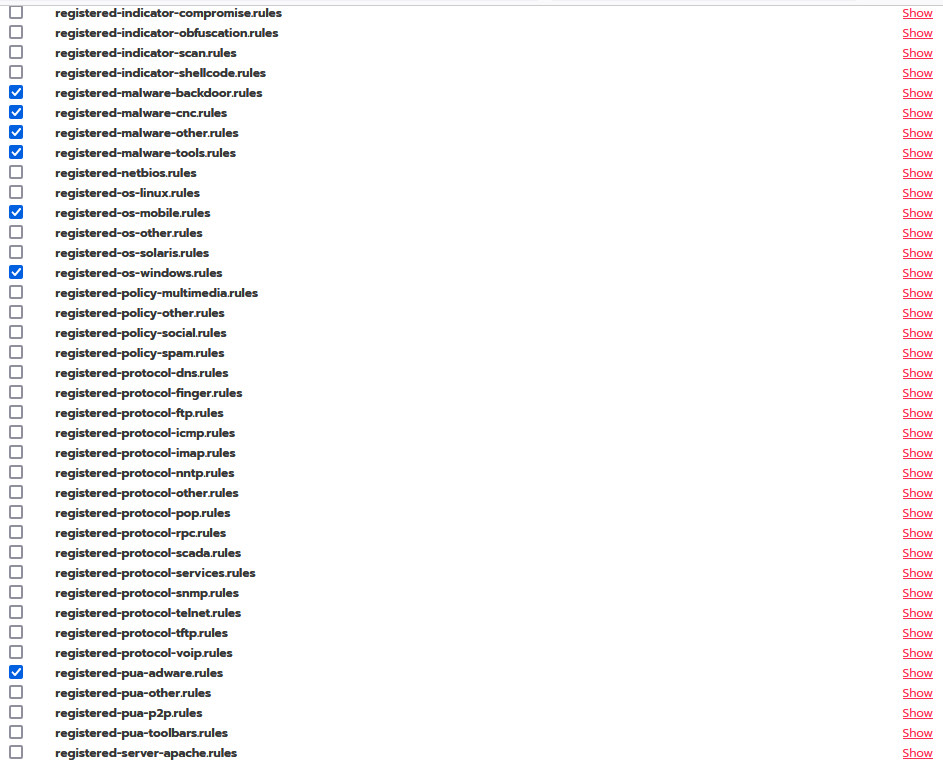
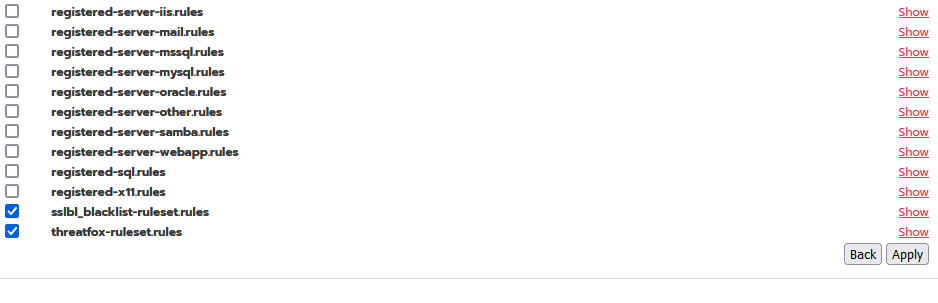
But apart from the possibility to select individual rules from the list via the “Customize Ruleset”-button I cant find anything to define how the IDS should behave.
On the Suricata website are details on the rules and i.e. what actions are taken (i.e. drop, reject). However, I cant find anything alike on IPfire so far.

More precisely, I would like to configure the IDS such that a rule match leads to the “offending IP” being blocked (=dropped) entirely for 1 hour, and I also like to have list of the currently blocked IPs (with some details, i.e. which rule matched). Currently, I just don’t know what exactly the system does when a match occurs, nor how I could configure the behaviour in more detail.

I know IPfire aims at “simple use”, which is obviously very different with pfSense which does offer ‘too many options’ sometimes, but it would be nice to know how/where I could customize IPfire a little bit more (perhaps I am just missing some hidden expert button/page).

Edit: Even customization on the command line (i.e. using root via SSH) would be fine, given proper documentation),.

Thanks in advance.

2 Likes

This is somewhat related to a more specific question regarding the IPS (see here), however more questions on the IPS arise.

Can anyone point me towards a more detailed docu on the IPS used by IPfire?

My IPS does this sometimes:

What is happening during this “Scanned”-spike? And, what does “Bypassed” and “Scanned” mean? What is the FW doing here?
Where is this documented in detail?

Thanks in advance

1 Like

Hi P Z,

Welcome to the IPFire community!

Understanding IPFire’s IPS

The IPS in IPFire is powered by Suricata, which analyses network traffic for malicious activity. It works alongside the firewall to inspect and block harmful packets, using rules to identify suspicious patterns or behaviours.

If you’d like more details, I recommend starting with the official documentation here: IPFire IPS Documentation.

What Do “Scanned” and “Bypassed” Mean?

Based on the statistics shown in the graph you shared:

  • Scanned: This is traffic that Suricata has fully inspected. It runs the data through its ruleset to determine if the traffic is safe or malicious. If a rule match occurs, the malicious packet is dropped by the firewall.
  • Bypassed: This is traffic that Suricata doesn’t inspect deeply. For example, if it determines the traffic is encrypted, or if the source is whitelisted, it skips further checks. Bypassing ensures that resources aren’t wasted inspecting traffic that doesn’t need it, as IPS scanning can be resource-intensive.

Looking at the graph you’ve shared, there’s a spike around 22:22 where roughly 13 MB/s of traffic was scanned for about two minutes. This shows that Suricata detected a flow of traffic worth examining more closely.

Why Doesn’t IPFire Automatically Block Offending IPs?

In IPFire, when a packet matches a rule, the firewall drops the specific packet. However, it doesn’t automatically block the offending IP for a set duration.

This is a deliberate decision to avoid false positives. For example, some rules might flag relatively minor anomalies, like a specific ping size, which might not actually indicate malicious behaviour. Automatically blocking such traffic could result in legitimate IPs being incorrectly blocked, causing unnecessary disruption.

Instead, IPFire focuses on immediate packet-level blocking, keeping things simple and avoiding risks associated with more aggressive automated actions.

Monitoring IPS Activity

To monitor the IPS activity:

  • Logs > IPS Logs: This shows detections from the IPS. These are the specific alerts triggered by Suricata’s rules.
  • Logs > System Logs: Select “Intrusion Prevention” in the section dropdown. This shows logs about the internal workings of the IPS, such as rules being updated or other operational details.

Both sections can give you a clearer picture of how the IPS is functioning.


Let me know if you have more questions, or if there’s anything specific you’d like help with in this area.

Thanks,
A G

2 Likes

Hi Adam,
first of all thanks for taking the time for such an elaborate reply. I knew already the page with the IPS docu. Is just not detailed enough I think.
Anyhow, I do appreciate your comments on “scanned” and “bypassed”.

However, I wonder about your description of bypassed, as it would include also the whitelisted traffic. Though it has its own (green) label. Is it really included?

I am still observing my traffic comparing it to the red (on which the IDS runs). Would you agree on the following?

  • Scanned: This is traffic that Suricata has fully inspected. It runs the data against its ruleset to determine if the traffic is considered safe or malicious. If a rule match occurs, the malicious packet is dropped by the firewall. No further steps are taken.
  • Bypassed: This is traffic that Suricata does not inspect. For example, if it determines the traffic is encrypted (i.e. https, ftps, ssh) then it skips further checks, as the FW cannot “read the packets contents”. This ensures that resources aren’t wasted inspecting traffic that doesn’t need it, as IPS scanning can be resource-intensive.
  • Whitelisted: Refers to any traffic for which the source is whitelisted.

Consider this as a proposed description which should go into the docu - if approved/confirmed.
Is anything else, beyond encrypted traffic in the “bypassed” section?
And for the whitelisted, is it really only the source IP?
(which makes sense somehow, but I’d like to be sure.)

And last but not least, I can understand the approach why IPs matching a rule are not blocked, but just the packed it dropped. And in deed, I have seen this with pfSense, that it can sometimes lead to “overblocking”.
However, it does need some more configuration, such as only matching specific rules leading to a blocked IP. Or even better, if an IP matches X specific rules within a certain time then it should be blocked.
Reason being, I see quite often certain IPs bothering my FW with port scans and other crap alike. So, as those are clearly malicious IMO, in such cases I’d prefer to just make sure they are excluded from any access to my IP, even the Apache which is generally public.

Does that make sense?

1 Like

Hi P Z,

Thanks for following up, and I appreciate your detailed observations.


Your description is a solid starting point, but it needs a small adjustment:

  • Scanned: Traffic that Suricata has fully inspected. It checks the data against its ruleset to determine if it’s safe or malicious. If a rule match occurs, the malicious packet is dropped by the firewall.
  • Bypassed: Traffic where Suricata skips deep inspection of the payload but still evaluates metadata like headers, source/destination IPs, ports, and traffic flow. For example, encrypted traffic (HTTPS, FTPS, SSH) is bypassed because the payload cannot be decrypted. This saves system resources.
  • Whitelisted: Traffic from whitelisted source IPs or subnets that skips all IPS checks entirely.

Yes, bypassed traffic isn’t limited to encrypted packets. It also includes high-bandwidth flows, often called “elephant flows.” These are large, sustained data streams, such as large file transfers or video streaming, where deep packet inspection of every packet can be resource-intensive with no additional benefits.

Bypass can also be triggered by specific rules, depending on the active ruleset, though I don’t think IPFire has any of these.


This is a valid suggestion, especially for dealing with persistent offenders like port scanners. While IPFire doesn’t support automatic IP blocking based on rule matches, you can still address this by:

  1. Reviewing frequent offenders in Logs > IPS Logs.
  2. Manually adding these IPs to a firewall group with a “drop” rule.
  3. Optionally enabling IP Blocklists to block known malicious IP addresses.

This method keeps things manageable while preventing unintended overblocking.


On Documentation:

If this thread has helped clarify things, you might want to consider sharing your insights in the IPFire documentation—it’s open to community contributions and can help others who have similar questions.

Let me know if you have further questions or ideas – happy to help.

Thanks,
A G

Hi, it’s been a few (more) days since I had a problem with the behavior of the IPS and the use of Tor relays.
It was due to a wrong IPS configuration, and a master of his trade took care of me and helped me install a working configuration.
In this context I came across the files and dictionary

/var/ipfire/ids-functions.pl
/etc/suricata/suricata.yaml
/usr/share/suricata/rules/

You may find answers to your questions there.

Hey Mum Pitz,
thanks for sharing the paths. I’ll have a look.

I am still observing the behaviour. It seems in deed that not only SSL traffic is “skipped”, but also the traffic generated by A/V streams, and also large file downloads.

The log under “IPS Logs” seems to supply also some information.
However, when I look under “System Logs” and select “Instrucion Prevention”, there is never anything. Perhaps that is meant to just show IPS errors, in such care ist would be fine to see nothing there, but I don’t know.

Cheers.

Did you click the “Update” button in the upper right? Here is a small snippet of what mine looks like:

What rulesets do you have enabled? I use:

Notice I have Etnetera Aggressive Blacklist Rules installed, but disabled (no check in box to the left of the pencil icon).

Also, click on Customize Ruleset and make sure to enable the rules you want to use within each ruleset. Here are the rules I have enabled:


1 Like

Hey Tim!
Thanks for the hint. Yes, I did push the update button, BUT… so far I always wanted to see the ‘recent entries’, hence somehow I always naturally looked on the current day. Which is always empty for me.

Total hits for log section suricata January 21, 2025: 0

However, your example was useful, as it implied there should be something. So, I did now look at some days before today, and tadda. There is something shown that looks quite similar to your screenshot.
So thanks mate!

Anyhow, is it perhaps the case that this log is generated “retrospectively”? Like cron perhaps f.e. at midnight the log for the passed day is generated? Perhaps I’ll keep a closer look at it around midnight…

It looks like my logs generate approximately at 6am and 6pm local time.

fcrontab runs the suricata rules update check every 12 hours

https://git.ipfire.org/?p=ipfire-2.x.git;a=blob;f=config/cron/crontab;h=7088e0b750a755b860a478b47d6be8809aacd803;hb=refs/heads/next#l65

The messages about flowbit is checked but not set is where those rules have been created incorrectly and probably will do nothing.

From the suricata forum the following was found

The warning message shows that the flowbits … are checked but never set. Flowbits provide a way to maintain state across a flow. Checking a flowbit but never setting it means the rule(s) doing so have no effect and will never generate an alert if the flowbit’s never set. That’s why Suricata is warning you.

This may happen if a rule is commented out (leading whitespace or # on the line containing the rule). This is most often the cause if you’re using a commercially provided (either free or with cost) ruleset.

These messages will be shown in the log if you modify the ruleset providers list or if you customise the ruleset as then all the rules are checked.

2 Likes