I have a weird situation here at home. For about the last 48 hours my IPFire opens ‘thousands’ of connections from its own gateway IP with accidental ports in a range from 43000 to about 54000 to its own gateway IP on port 81. I can see that in the connection tracking screen. Black coloured lines all overall there. Status is ‘TIME_WAIT’.
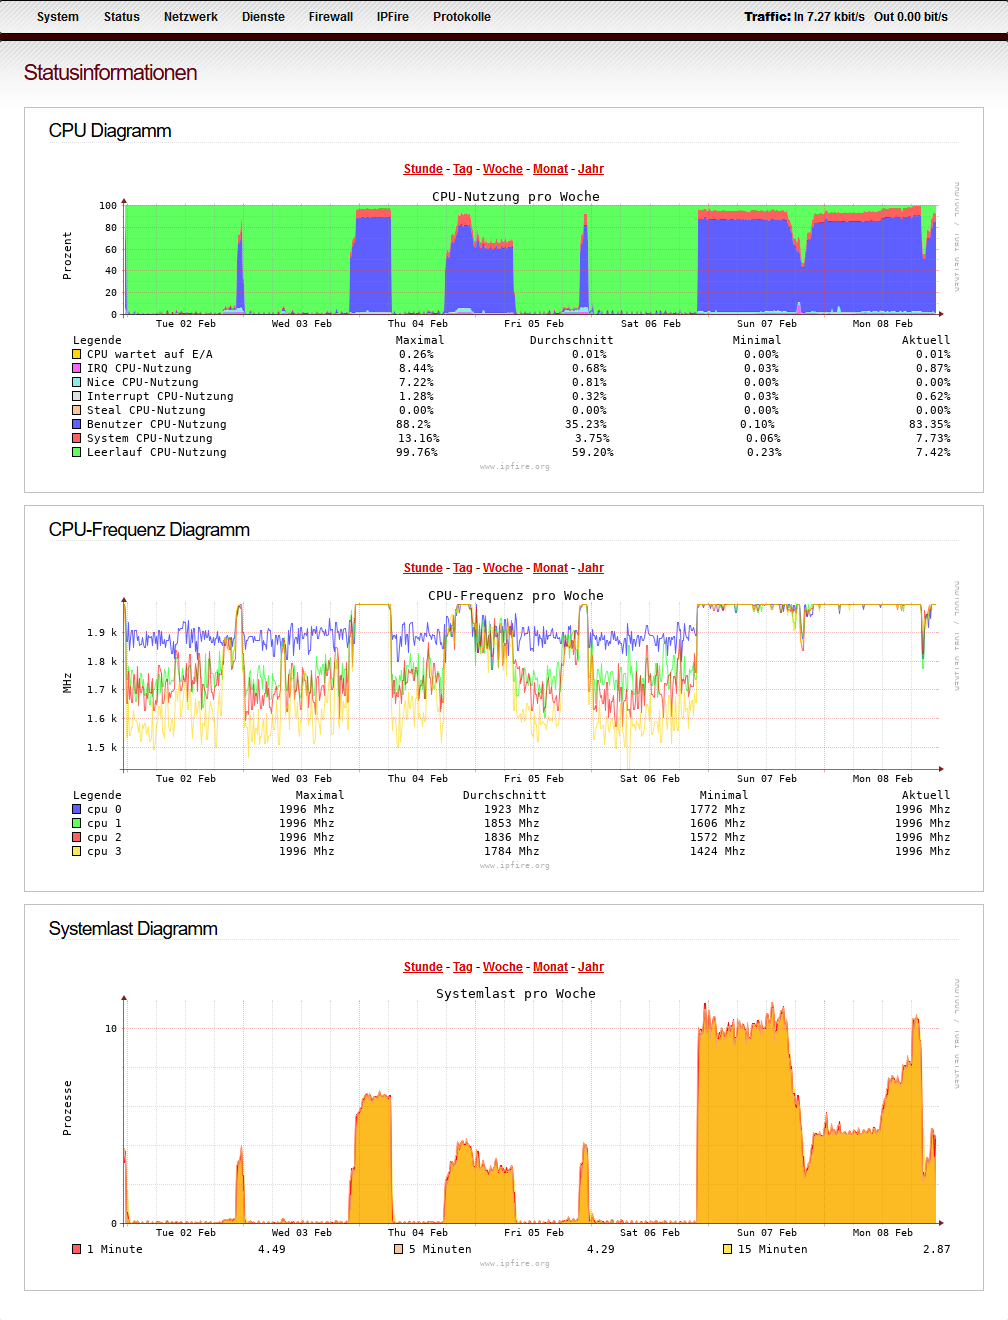
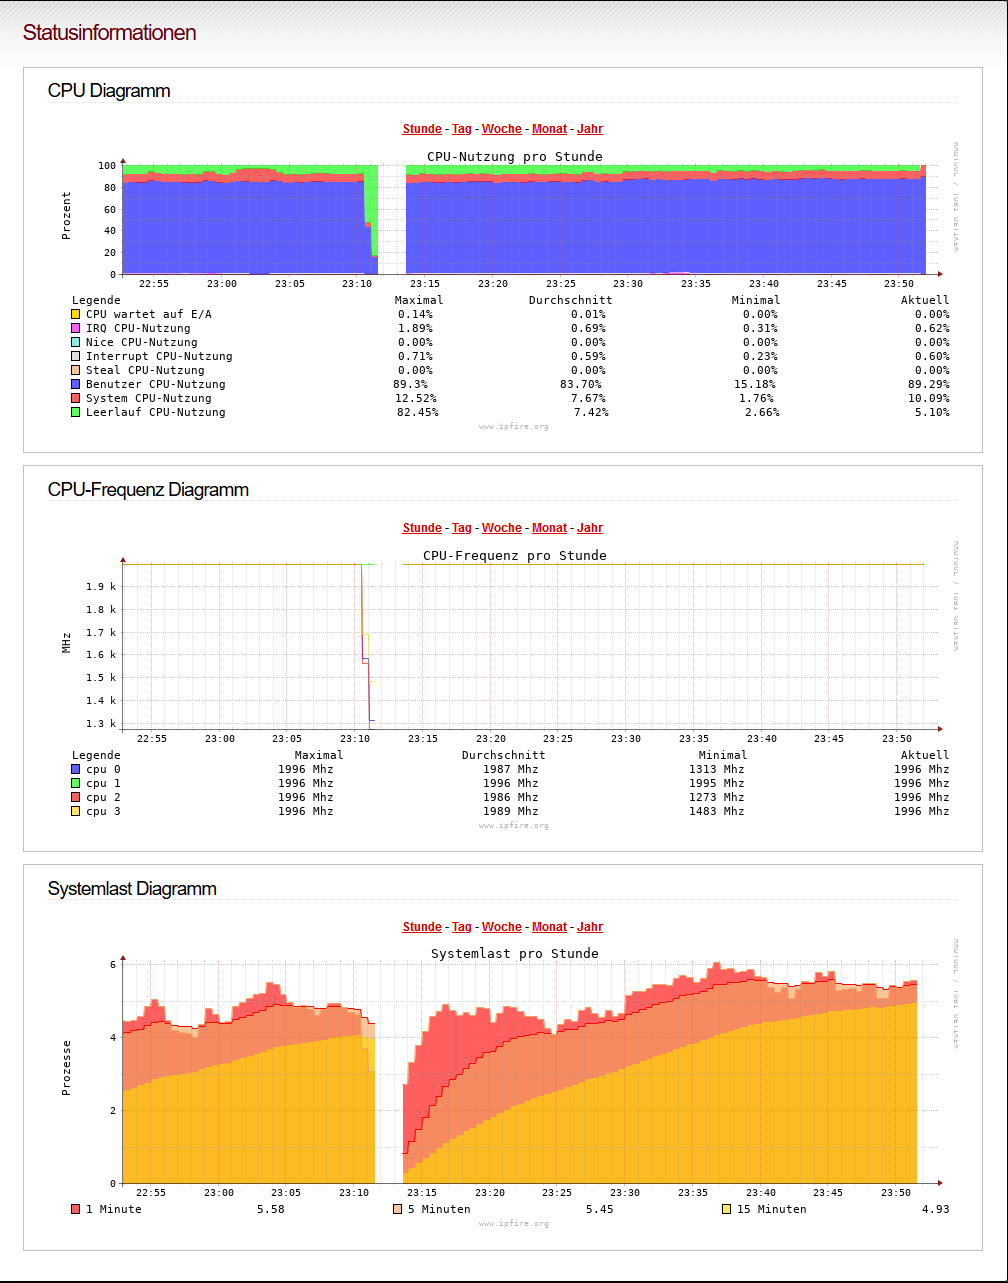
CPU load goes to nearly 100%. The Status information screen → CPU diagram shows 80% CPU usage by ‘user’.
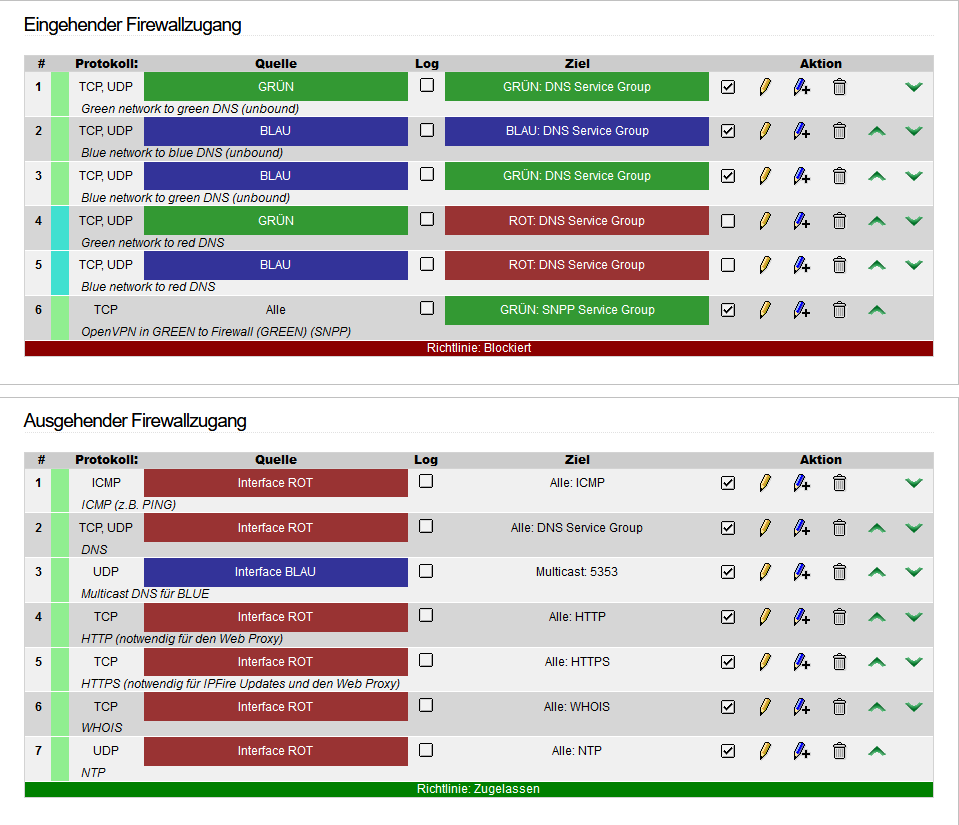
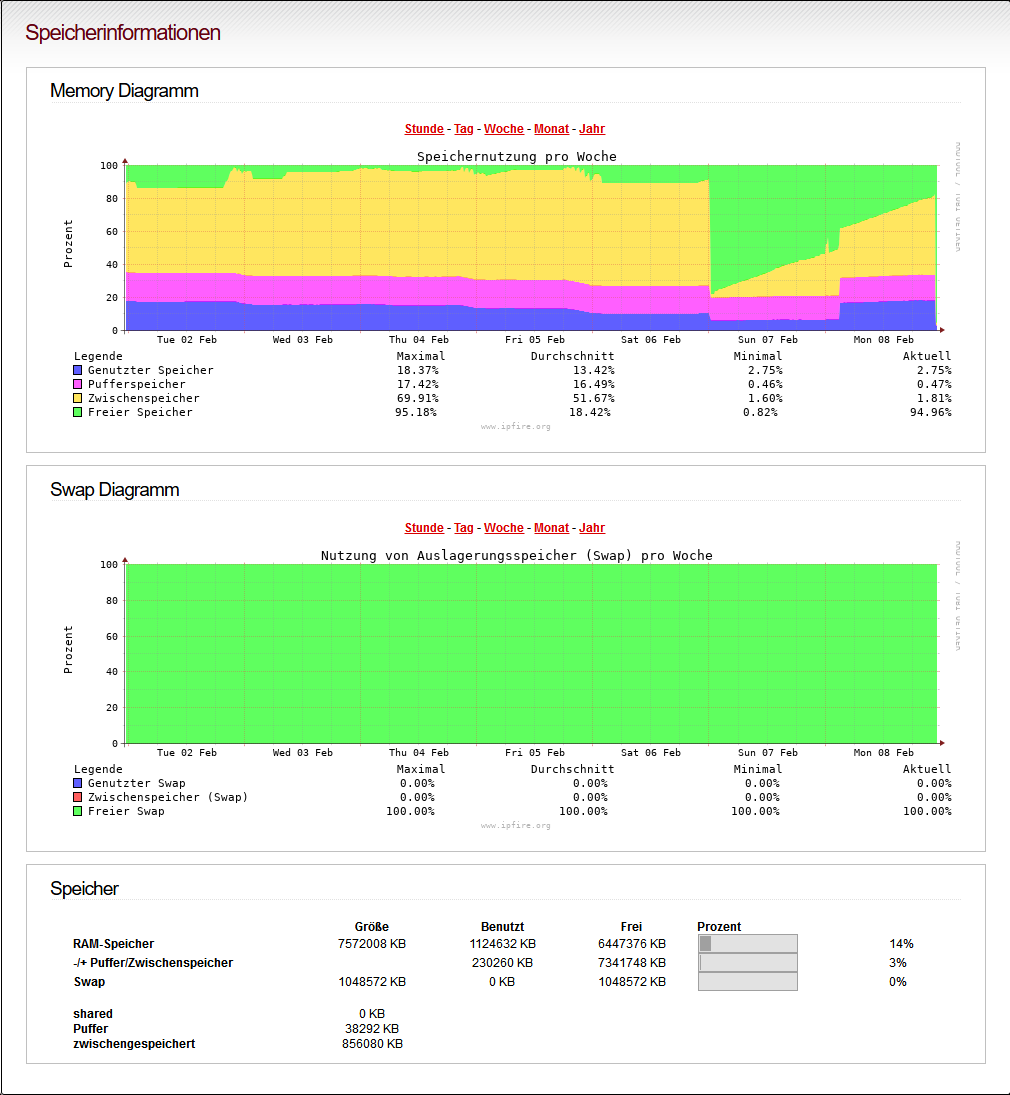
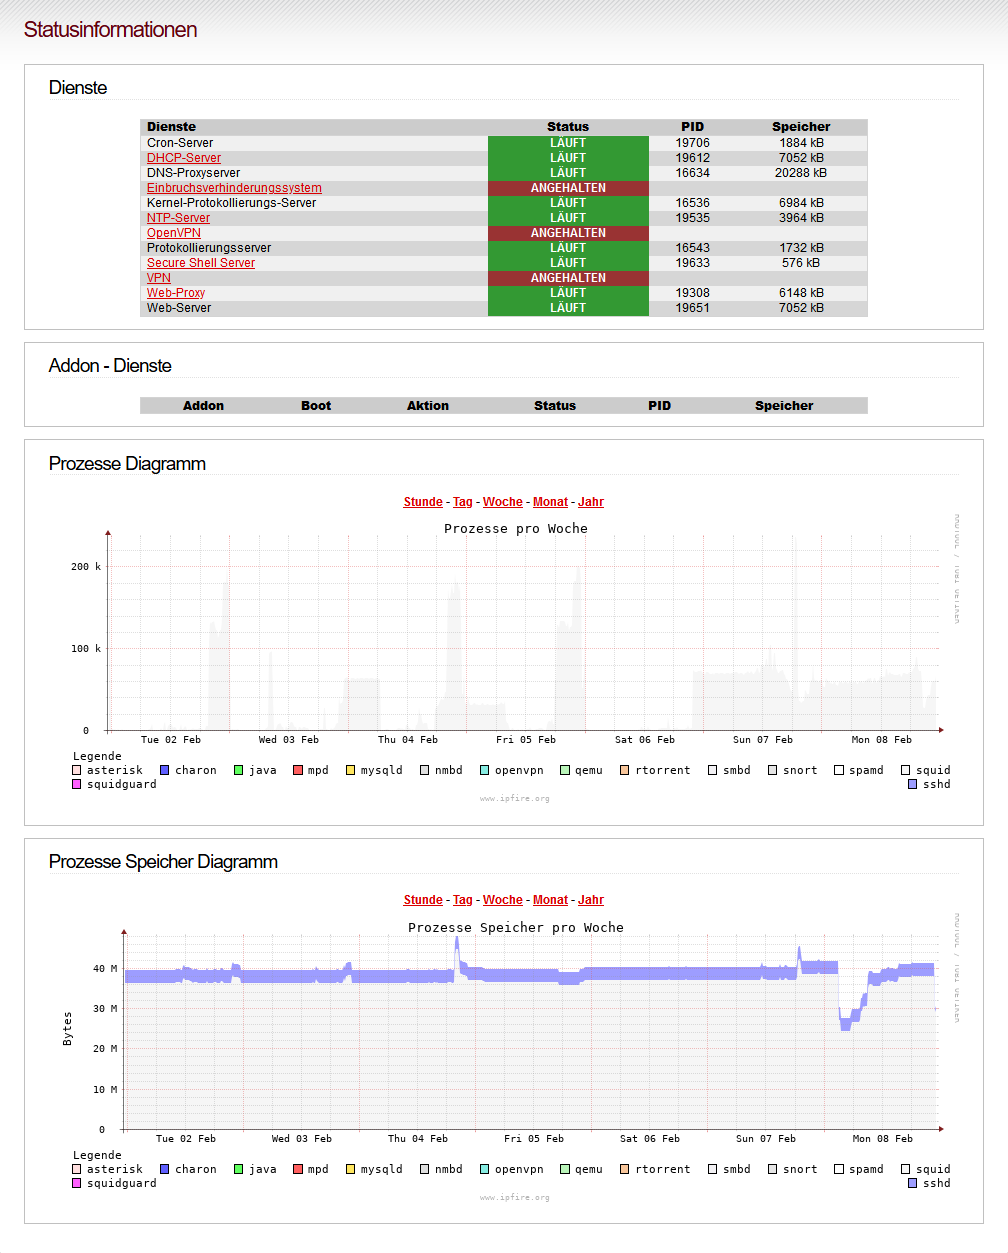
I did not install anything. No new services or such. I only do the updates. I do not use virus scanning or intrusion prevention. Only Squid non-transparent on port 800, URL-Filter, unbound DNS over TLS, DHCP. All ports are blocked for Forward chain as a standard. Also port 81 is not opened by me. I have several rules for outgoing ports. Nothing changed since Saturday only some ports opened for two new multiplayer games of my son on Saturday and today.
Core 153 running for several weeks now without problems until Saturday evening. Reboots do not solve the problem. After restart the CPU goes to nearly 100% load instantly.
Did someone encounter the same problem in the past? A web search did not show anything except this unanswered post in the old forum in German: https://forum.ipfire.org/viewtopic.php?t=13378
since I went to bed last night the CPU load suddenly has gone down to normal with some intermittent load spikes every full hour for about five minutes up to 20% CPU usage. All the connections to port 81 are gone.
Cat /var/log/messages does not show anything special. Only messages from last reboot, a pakfire list update and some dropped ports from inside due to standard blocking behaviour.
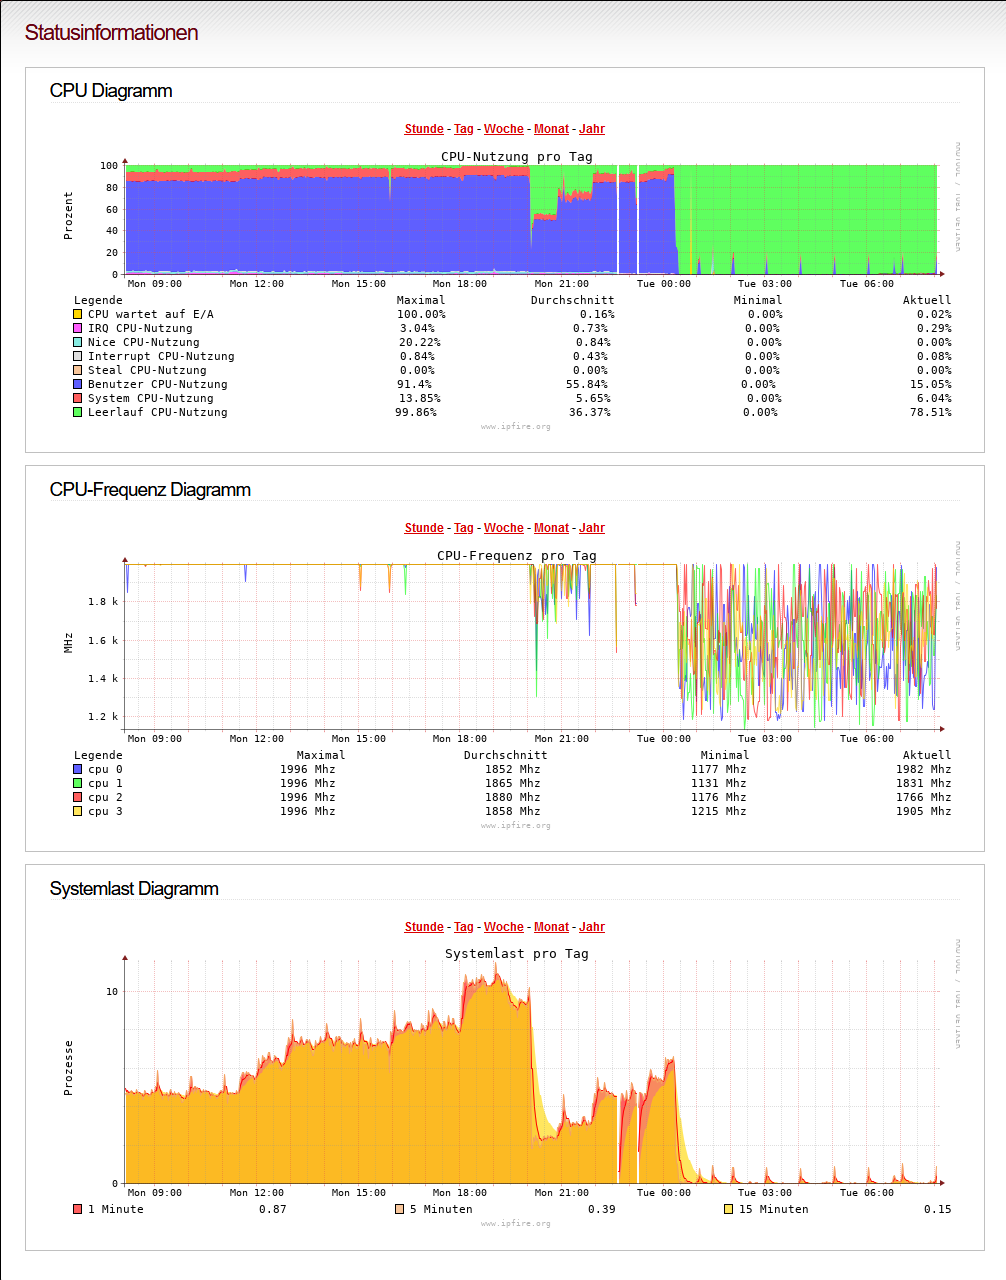
I did some more research and I think I nailed it down. I had the same behaviour today between about 17:10 and 19:00 o’clock (estimating from the CPU load diagram). I had a look at the protocols in th eWeb GUI protocol section and noticed that the URL-Filter protocol for today needed a larger amount of time to load. It had about 164.000 hits today. Then I had a look at yesterdays protocol and it needed about 5 minutes to show up. It had an insane amount of about 1.900.000 hits for yesterday. I could not export it because it was too large. The browser tab did get killed by it!
Looking at today’s exported URL Filter protocol I saw about 30.000 identical entries between 17:10 and 18:54 o’clock.
Yesterday it seemed about 1.900.000 of such entries, all of them identical.
This comes from Kodi Media Center software running on some clients here. It hits the URL-Filter with either category ‘porn’ or ‘custom-expressions’. Kodi or some Kodi AddOn does not stop queryiing the MovieDB if it does not get an answer. This is bad software design.
My solution is (and I hope I found the source of my troubles) to allow ‘api.themoviedb.org’ via URL Filter whitelist.