Sometimes when I’m looking at the Firewallhits Graph at Status->Network(other) I will see some value on the “To Hostile Networks” line.
What is the quickest way to determine the green IPs that are responsible for this traffic?
Sometimes when I’m looking at the Firewallhits Graph at Status->Network(other) I will see some value on the “To Hostile Networks” line.
What is the quickest way to determine the green IPs that are responsible for this traffic?
Go to the Firewall Logs line in the Logs menu of the WUI.
Press the Export button and you will get all the log enjtries for the time period you have chosen in a web browser page.
Just search through then for DROP_HOSTILE at the time period you are seeing that on the graph and the line will tell you the IP for the source.
Here is an example from my logs
14/14:23:50 DROP_HOSTILE IN=green0 OUT=red0 MAC=00:0d:b9:5e:aa:dd:08:71:90:42:7b:ce:08:00 SRC=192.168.26.37 DST=50.118.225.16 LEN=60 TOS=0x00 PREC=0x00 TTL=63 ID=18610 DF PROTO=TCP SPT=34076 DPT=443 WINDOW=64240 RES=0x00 SYN URGP=0
Bear in mind that the most likely cause is that when you are browsing that you end up looking at a website that has all sorts of other links on it for other third party aspects and all it needs is for some of those to be going to a site that is hosted on a DROP_HOSTILE site.
A lot of the DROP_HOSTILE sites now provide hosting services on a very cheap basis and they are trying to get enough “good” sites on their systems that their IP’s will no longer get dropped but that doesn’t look to be happening. So users need to also be careful which hosting services they use, and make sure that it is not from an ASN that is on the DROP_HOSTILE list.
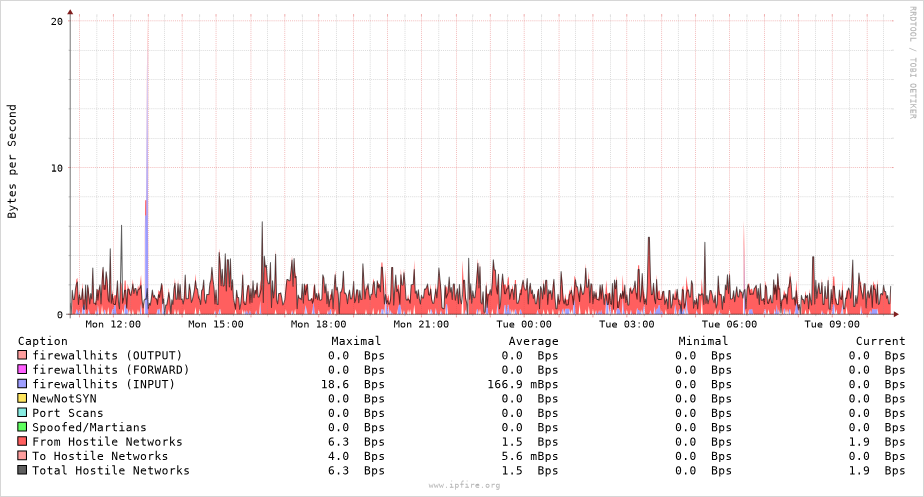
Thanks, that is how I was trying to find the offending green IP, so I guess I was doing it right. But I’m getting no hits. Here is the graph:
So it has to be in the last 24 hours. But I exported today, yesterday, and the day before that and the only search result for DROP_HOSTILE was from yesterday on the RED interface. No hits on the GREEN interface.
12:13:11 DROP_HOSTILE IN= OUT=red0 SRC=70.164.192.226 DST=202.61.85.215 LEN=60 TOS=0x00 PREC=0x00 TTL=64 ID=17688 DF PROTO=TCP SPT=57844 DPT=80 WINDOW=42340 RES=0x00 SYN URGP=0
12:13:07 DROP_HOSTILE IN= OUT=red0 SRC=70.164.192.226 DST=202.61.85.215 LEN=60 TOS=0x00 PREC=0x00 TTL=64 ID=17687 DF PROTO=TCP SPT=57844 DPT=80 WINDOW=42340 RES=0x00 SYN URGP=0
12:13:05 DROP_HOSTILE IN= OUT=red0 SRC=70.164.192.226 DST=202.61.85.215 LEN=60 TOS=0x00 PREC=0x00 TTL=64 ID=17686 DF PROTO=TCP SPT=57844 DPT=80 WINDOW=42340 RES=0x00 SYN URGP=0
12:13:04 DROP_HOSTILE IN= OUT=red0 SRC=70.164.192.226 DST=202.61.85.215 LEN=60 TOS=0x00 PREC=0x00 TTL=64 ID=17685 DF PROTO=TCP SPT=57844 DPT=80 WINDOW=42340 RES=0x00 SYN URGP=0
12:13:03 DROP_HOSTILE IN= OUT=red0 SRC=70.164.192.226 DST=202.61.85.215 LEN=60 TOS=0x00 PREC=0x00 TTL=64 ID=17684 DF PROTO=TCP SPT=57844 DPT=80 WINDOW=42340 RES=0x00 SYN URGP=0
12:13:02 DROP_HOSTILE IN= OUT=red0 SRC=70.164.192.226 DST=202.61.85.215 LEN=60 TOS=0x00 PREC=0x00 TTL=64 ID=17683 DF PROTO=TCP SPT=57844 DPT=80 WINDOW=42340 RES=0x00 SYN URGP=0
12:13:01 DROP_HOSTILE IN= OUT=red0 SRC=70.164.192.226 DST=202.61.85.215 LEN=60 TOS=0x00 PREC=0x00 TTL=64 ID=17682 DF PROTO=TCP SPT=57844 DPT=80 WINDOW=42340 RES=0x00 SYN URGP=0
12:13:00 DROP_HOSTILE IN= OUT=red0 SRC=70.164.192.226 DST=202.61.85.215 LEN=60 TOS=0x00 PREC=0x00 TTL=64 ID=17681 DF PROTO=TCP SPT=57844 DPT=80 WINDOW=42340 RES=0x00 SYN URGP=0
SRC=70.164.192.226 DST=202.61.85.215
If you have either ip address scheme in ipfire, redo your net address to prooper local networking ip scheme.
Otherwise, this is background noise from bad routing
I am not totally sure but I think all the colour you are seeing is the one from the “From Hostile Networks”. The “To Hostile Networks” colour is a bit more orangy than the other one.
Anything coming in to the red interface I have the logging turned off for, as there will always be a huge number of those bad sites trying to access but if they have been dropped trying to get in then I am not bothered about reviewing them.
So I only have the DROP_HOSTILE turned on for anything going out to a hostile network.
If there isn’t anything in the logs then I think you don’t have anything sending stuff out but the good thing about having DROP_HOSTILE turned on is that if something does occur it will be stopped before it can get out of your network.
suspect over time there will be more “false” positives because various websites will end up being setup on hosting sites that are part of bad ASN’s.
The one shown on my example is a Hosting provider in The Netherlands (Unfortunately one of the worst locations in the world for these bad ASN’s) but I accept that I will not be able to access those.
The fact that there are values in the “To Hostile Networks” row is what lead me to believe there was traffic going out to a hostile network from GREEN. Maximal=4.0Bps; Average=5.6mBps. Am I misinterpreting that? The timeframe is 24 hours, so it would have to be either today or yesterday. And when I switch the graph to HOUR, I get a 0 value for “To Hostile Networks”, which leads me to believe it was more than 1 hour ago, but not more than 24 hours ago.
No, you are not.
I looked at the graph but not at the table below it. Duuuh.
So your conclusion is what I would also come to. Unfortunately I don’t know why that is occurring.
That might be a question worth asking on the Dev Mailing list. Maybe there is some explanation for how those log results are being interpreted in the graphs or there might be a bug in the data collection for the graphs. The Dev Mailing list is the best location to get the question answered on if it is a bug or if there is an explanation for what you are seeing.
on the isp side: TCP packets will return an ACK/RST which is the same response that an open port with no service on it will respond with. Some routers will respond with and ACK/RST on behalf of servers which are down. So what someone would have to check if ipfire is sending acknowledgement/reset after drop. Which is the only thing I can see that could log traffic.
But if its solicited traffic from the green network, it would log in access logs at the same time.
I have checked this on my system.
Took a random IP from SpamHaus DROP and tried it in my browser.
Log message is just as shown by @bloater99 ( src=my red IP, dst=IP chosen, dpt=80 ). This means the hostile access is blocked, when done by the proxy.
To find the internal client, initiating the access, one must examine the proxy logs ( access.log ) also.
I believe you could also see the green IP in FW-Loggraphs (IP), but you have to search it out by clicking on several IPs until you find the one with the DROP_HOSTILE descriptor.
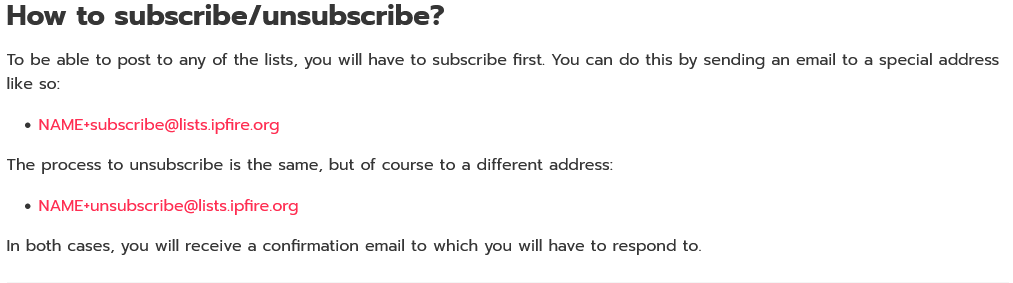
I looked into how to subscribe to the dev mailing list. I see this:
and am unclear on whether NAME is my real name, forum name, or whether it is literally NAME. Or does it even matter.
When I hold my pointer over the link it shows
mailto:NAME+subscribe@lists.ipfire.org
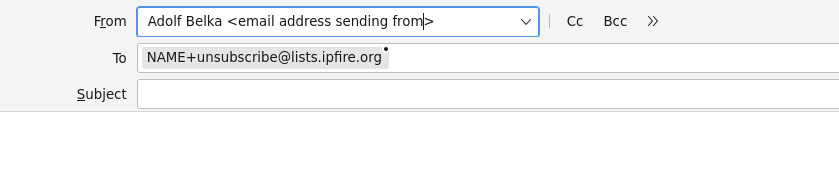
I then clicked it and it put the whole of that line into the senders email section of my email client.
So copy it exactly and I think the NAME bit tells the subscribe email system to use the email address that you will have sent the message from as the address to be subscribed.
It’s been 45 minutes since I sent the email. How long should it take to get confirmation? If that is normal, I will gladly keep waiting, but wasn’t sure if I did something wrong. I did leave the subject field blank, as it didn’t say to put anything in particular in there.
I am afraid I don’t know. I subscribed many years ago and it has changed a couple of times since then.
Blank subject line shouldn’t be a problem.
@ms would be best to comment about if everything is as expected or if there is a problem.
NAME is the name of the list. So it would be “development+subscribe@lists.ipfire.org”.
I could not figure out how to find the green IP in the proxy logs.
This seems like something that would be kind of important for a network admin to be notified of. If there’s an infected device that is trying to reach out to malicious sites, I’d want to be aware of it ASAP so I could take it offline. Of course, the device may not be infected, but the point is valid. Internal devices reaching out to HOSTILE networks should be flagged for immediate attention IMO.
This is a bit tricky.
The HOSTILE networks check is located in the firewall. In case of web access using a proxy the packet isn’t directed to these networks but the proxy ( IPFire, a well trusted IP ).
The packet is logged to /var/log/squid/access.log with an entry like
1748437861.644 32 192.168.20.132 TCP_TUNNEL/200 39 CONNECT cdn.shopify.com:443 - HIER_DIRECT/23.227.60.200 -
I just checked another IPFire that also has proxy enabled, and I found a green IP in the logs.
15:12:59 DROP_HOSTILE IN=green0 OUT=red0 MAC=02:49:d0:57:d6:55:1a:84:37:3f:fe:21:08:00 SRC=192.168.11.234 DST=95.181.182.182 LEN=60 TOS=0x00 PREC=0x00 TTL=63 ID=46035 DF PROTO=TCP SPT=41846 DPT=443 WINDOW=65535 RES=0x00 SYN URGP=0
15:12:57 DROP_HOSTILE IN=green0 OUT=red0 MAC=02:49:d0:57:d6:55:1a:84:37:3f:fe:21:08:00 SRC=192.168.11.234 DST=95.181.182.182 LEN=60 TOS=0x00 PREC=0x00 TTL=63 ID=60507 DF PROTO=TCP SPT=41838 DPT=443 WINDOW=65535 RES=0x00 SYN URGP=0
Do you know what might be different about this one that is allowing me to see the GREEN IP? The main difference between this IPFire and the other one from my first post is this one handles DHCP while the other one does not.
Personally, to find if a PC in green zone may be infected I look into Logs - IP Address Blocklist Logs to see if something counts in Packets dropped (OUT) column, and if I saw some hits, I investigate into Details.
Yes, this is a method I employ too. But the outgoing DROP_HOSTILE is a different set of rules with an extremely high level of confidence.
A network admin should want to know which clients in their network are attempting to initiate contact with a hostile network.