High average load for IO?

2.279 / 5.000
Hello
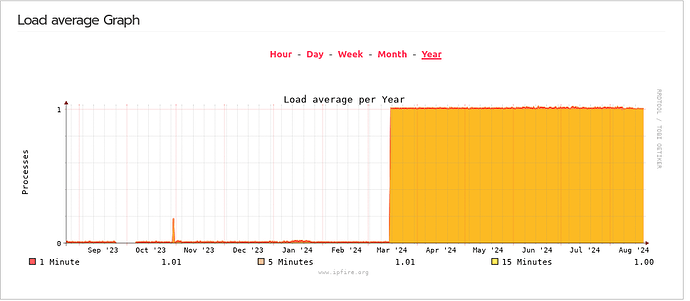
After I got an upgrade to version 2.29-183 in March 2024, the CPU load is permanently 100%. However, But I cannot find a running task that creates a corresponding load.

[root@ipfire ~]# uptime
  09:32:34 Up 13 Days, 22:46, 1 User, Load Average: 1.00, 1.00, 1.00

[root@ipfire ~]# top
TOP - 09:34:29 Up 13 Days, 22:48, 1 User, Load Average: 1.00, 1.00, 1.00
Tasks: 139 Total, 1 Running, 138 Sleeping, 0 Stoped, 0 Zombie
%CPU0: 0.0/0.0 0 [] %CPU1: 0.0/0.0 0 []
%CPU2: 0.0/0.0 0 [] %CPU3: 0.0/0.7 1 []
Give Mem: 5.5/7.6 [] Give Swap: 0.0/1.0 []
 Unknown Command - Try 'H' For Help
 PID User PR NI VIRTI %CPU %Mem Time+ S Command
 1 root 20 0 2.5m 1.5m 0.0 0: 15.29 s Init
 336 root 20 0 13.0m 4.6m 0.0 0.1 0: 00.04 S `- Systemd-Udevd
 381 root 20 0 12.2m 3.7m 0.0 0.0 0: 00.00 D `- (UDEV worker)
 679 root 20 0 26.5m 5.1m 0.0 0.1 0: 00.10 s `- udevd
 1922 Root 20 0 5.3m 3.6m 0.0 0 0 1: 39.73 S `- VNSTATD


[root@ipfire ~]# w
 09:37:24 Up 13 Days, 22:51, 1 User, Load Average: 1.00, 1.00, 1.00
User Tty Login@ Idle JCPU PCU What
Root PTS/0 08:41 0.00S 0.05S? W
[root@ipfire ~]# ps -eo s, user, cmd | Grep ^[Rd] | Sort | Uniq -c | Sort -nbr | Head -20
 1 r root ps -eo s, user, cmd
 1 D root (UDEV worker)

I have read that IO-Tasks can generate high load (UDEV Worker?).
My system:
Ipfire version Ipfire 2.29 (X86_64) - Core187
Pakfire version 2.29-X86_64
Kernel Version Linux Ipfire.rs 6.6.32-IPFire #1 SMP Preempt_Dynamic Mon Jun 10 19:01:56 GMT 2024 X86_64 Intel (R) Celeron (R) J6412 @ 2.00GHz Genuineinel GNU/Linux

Who can help me. Thank you in advance.
Torsten

PS.: Excuse me my bad English.
Hi @oberp

Welcome to the IPFire community.

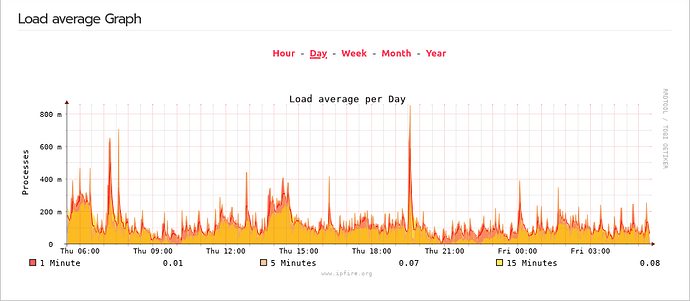
The graph you have shown is not the cpu %, it is the load average graph which is extremely difficult to interpret what it is saying.

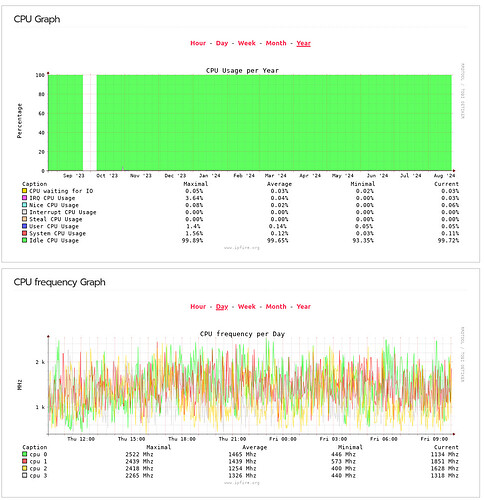
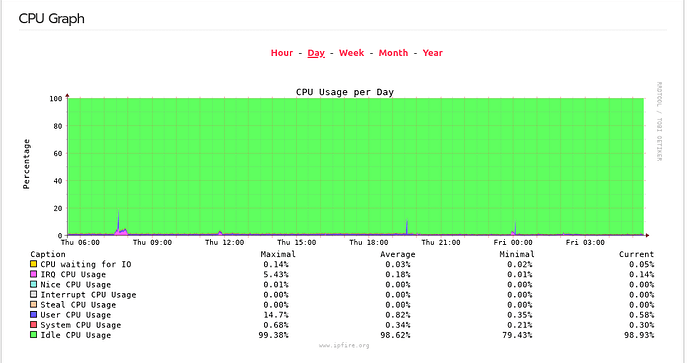
The cpu graph is on the same WUI page but the graph above the Load Average graph.
Does that cpu graph show 100% of system or user cpu usage?

EDIT:
I missed that you had provided top output and this shows that the cpu has virtually no load.

On that basis I would not worry about the Load Average Graph. I have no idea what it is actually telling you. I would have to go and look at the code to figure that out.
I believe it is a composite calculation of several things but what the final result actually means, I have no idea.

Hello Adolf

Thanks for the quick help.

The other two diagrams on the “System” page look like this:

At the graphic “Load Average Graph” (first post) you can see how the CPU load increases from 0 to 100% with the upgrade from 03/15/24.

The computer on which Ipfire runs is only passive and the cooling ribs are always quite warm (approx. 45 ° C) without great data traffic.
The CPU load is not really bad now either. Maybe the problem will take care of one of the next upgrades on its own 
 :slight_smile:
Thanks again,
greetings Torsten

Yes, I can see that it has gone up. However it is not 100%. The axis of that graph is average number of processes, so it is at a level of 1 process. You can have it go higher, on my system currently there was recently a peak up to 1.25 average number of processes and on the wiki page it shows a peak value of 4 processes load average for a short time.

I understand that as it occurred after an update and that it is staying at that higher level, it gives concerns but unfortunately I have no idea how to figure out what is making it do that.

Your cpu level is running on average at 0.25% with a max value of 3%. Based on that is why I would say not to worry about the Load Average Graph.

This seems to be a graph that raises more questions than it is able to answer and it is not one that I usually bother looking at as I don’t know what it is telling me.

Sorry I can not help more. Maybe someone else has some other ideas.

2 Likes

Hello Adolf

Yes, i can see that it has gone up. However it is not 100%. The axis of that graph is average Number of Processes, so it is at a level of 1 process.

Ok, if you can read, it is clear :slight_smile:
I keep an eye on the diagram and get back here when something happens in this regard (after an upgrade ?).

Thanks again for the help.
Greetings Torsten

Just for fun here is my graph


cpu graph

Are you using some addons or features which may have gone into an intensive ‘listen loop’?
My values for the same period are
1 minute: 0.11 5 minutes:0.09 15 minutes: 0.07

Addons are apcupsd, QoS, OpenVPN.

The question was directed to @oberp. :wink:

Hello Bernhard
Addons in use: hostapd, htop, iotop, iperf3, lshw, nmap
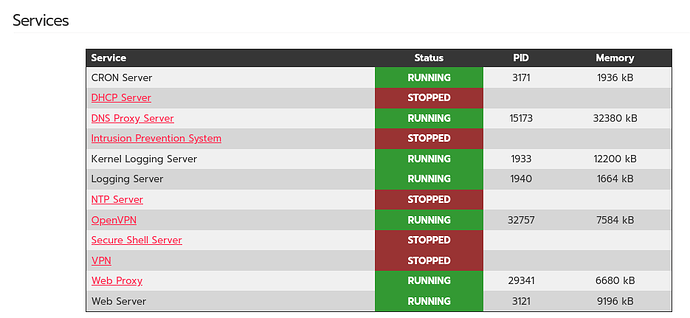
services in use: cron, dhcp, dns proxy, logging, ntp, open-vpn, proxy, web

Greetings Torsten

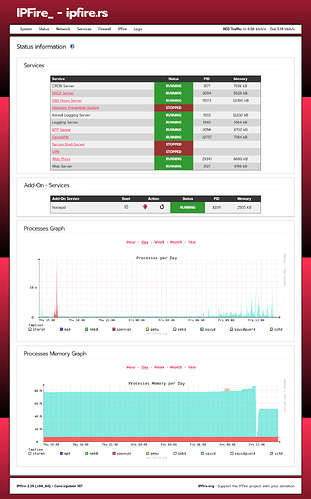
I don’t have an answer. I will just add that load is not necessarily tied to cpu directly. Your Celeron J6412 has 4 cores. It can represent number of running processes if I remember correctly. What I remember is any load value that is less than number of cores is considered acceptable. In other words, if your load exceeds 4.0, then things will really bog down. The fact that you are at 25% of that capacity means things are still in a “normal” range. But still, it is unusual and different from before your C183 update and should be investigated. Could you show a screenshot of your Services page? Including services and process.

The other peculiar thing is that whatever the process is it is staying in place with reboots as it started after updating to CU184 but you are now on CU187. So at least one reboot with CU187 and maybe more with other CU’s since March and the average process level has stayed at 1 the whole time.

@oberp
Load average measures the number of tasks in state running.
With a constant value of 1.0 you should be able to capture this task in top with filtering ( command o, filter expression S=R ).

EDIT:
Having written this, I had a temporary high level of load values.
top showed me suricata as process with high CPU usage. It resulted from a restart.
Maybe you have some other process which has problems in initialisation.

1 Like

Hello all,

@bloater99: Bitte schön:

@bbitsch:
The output of ‘top’ shows that there are only 2 running tasks:

  1. ‘top’ itself (state ‘R’):
    4156 ROOT 20 0 8.3m 4.8m 0.0 0.1 0: 00.02 R Top -B -Sort -Oberride = S

  2. UDEV (state ‘D’):
    381 root 20 0 12.2m 3.7m 0.0 0 0: 00.00 D (UDEV worker)

Torsten

I usually regularly upgrades with about 2 weeks of delay. That means restart every time.
Torsten

1 Like

I don’t have this task (UDEV worker).

Start disabling the services one at a time and check the load after each one. Don’t forget the add-on service ‘hostapd’. Hopefully we see the load drop after one of them is disabled?

[root@ipfire ~]# /etc/init.d/dhcp stop
Stopping DHCP Server
 [ OK ]
Stopping Unbound DHCP Leases Bridge
 [ OK ]
[root@ipfire ~]# /etc/init.d/ntp stop
Stopping ntpd
 [ OK ]
[root@ipfire ~]# /etc/init.d/hostapd stop
Stopping hostapd
 [ OK ]
[root@ipfire ~]# uptime
15:32:34 up 14 days, 4:46, 1 user, load average: 1.05, 1.01, 1.00

Since I am already at home (connected by VPN), it is difficult to switch off more services. I’ll get in touch on Friday next week 

So far thanks to everyone
Torsten

Do you have any USB memory sticks attached to your system via the ExtraHD page? Those might end up using the udev system.

Incidentally, I also only have top going permanently when I run the command. The others like squid come on for a very short time and then back off again.
I definitely don’t have a UDEV worker running permanently or showing up anywhere in the top list.

EDIT:

I searched on the top status D and this means that there is a process that is waiting for something to happen but it cannot be interrupted by a signal. The fact that it is related to UDEV worker suggests something like a driver for something where udev is sitting there waiting for something to happen. That would explain why the process is there at a level of 1 but the cpu% is not going high. There is a process running but waiting for some signal.

1 Like

No. No sticks, keyboards or mice.
Access only by web browser and SSH.
Torsten