Hello,
I have just completed tests to monitor IPFire (and more) with a third-party solution.
I want to share my experience but don’t know if it’s allowed or off topic
Hello,
I have just completed tests to monitor IPFire (and more) with a third-party solution.
I want to share my experience but don’t know if it’s allowed or off topic
For my part, anything about IPFire is on topic. But I am just another IPFire user.
I was looking for an overview of different sites under supervision.
PandoraFMS allows this information to be grouped via agents installed on Linux, Windows, IPFire servers and even NAS.
This solution can bes installed onPremise or through Internet :
1- Install CentOS 7 which can be dowload here
don’t forget to enable network during installation
2- Once installed, Update it : yum update -y
3- The simplest way to install PandoraFMS is to run : curl -Ls https://pfms.me/deploy-pandora | sh
During installation, the bash script disable the firewall. I prefer to reactivate it and add exeptions :
systemctl enable firewalld
systemctl start firewalld
firewall-cmd --zone=public --permanent --add-port=443/tcp
firewall-cmd --zone=public --permanent --add-port=41121/tcp
firewall-cmd --reload
4- Connect to pandoraFMS : https://CENTOS-IP-ADDRESS/pandora_console
login : admin // password : pandora
5- On IPFire Console :
wget http://firefly.artica.es/pandorafms/latest/Tarball/pandorafms_agent_linux-7.0NG.tar.gz
tar xzvf pandorafms_agent_linux-7.0NG.tar.gz
cd unix
./pandora_agent_installer --install
pakfire install nano -y
6- Configure agent
nano /etc/pandora/pandora_agent.conf
change server_ip localhost by
server_ip CENTOS-IP-ADDRESS
start the service : /etc/init.d/pandora_agent_daemon start
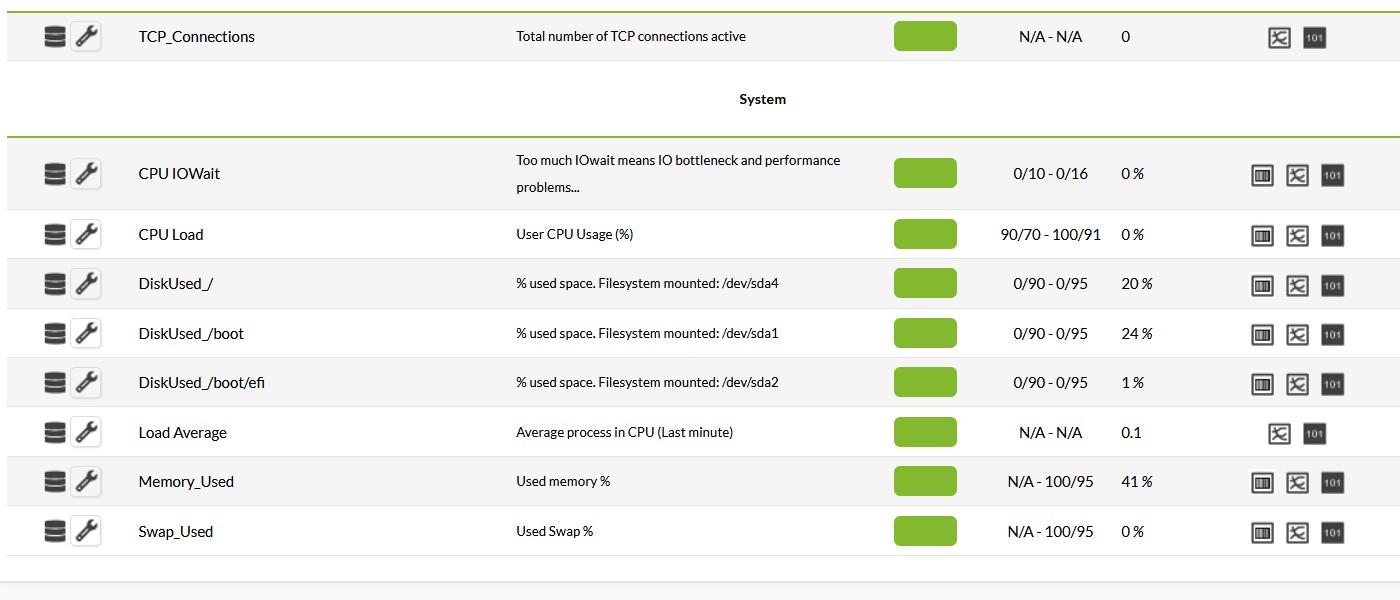
7- On PandoraFMS web interface, clic on Monitoring, Views, Agent detail ; find your IPFire and see the informations feedback by default :
8- IPFire Agent Customization
If you want to monitor the status of a special service. On IPFire, edit /etc/pandora/pandora_agent.conf and add this lines at the end :
# Check samba service state
module_begin
module_name samba_Status
module_type generic_data_string
module_exec ps -ef | pgrep smbd | grep -v grep ; [ $? -eq "0" ] && echo active || echo inactive
module_str_critical inactive
module_group Service
module_end
If you want to test the status of a special module, at the end of the pandora_agent.conf, add this lines :
# Check openvpn module state
module_begin
module_name ovpn_Status
module_type generic_data_string
module_exec ps -ef | pgrep openvpn | grep -v grep ; [ $? -eq "0" ] && echo "active" || echo "inactive"
module_str_critical inactive
module_group Service
module_end
and restart the service to take effect : /etc/init.d/pandora_agent_daemon restart
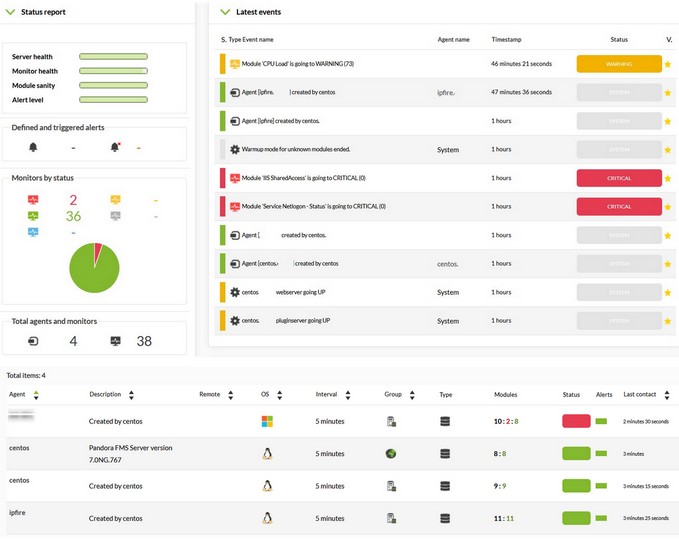
This is an exemple of overview
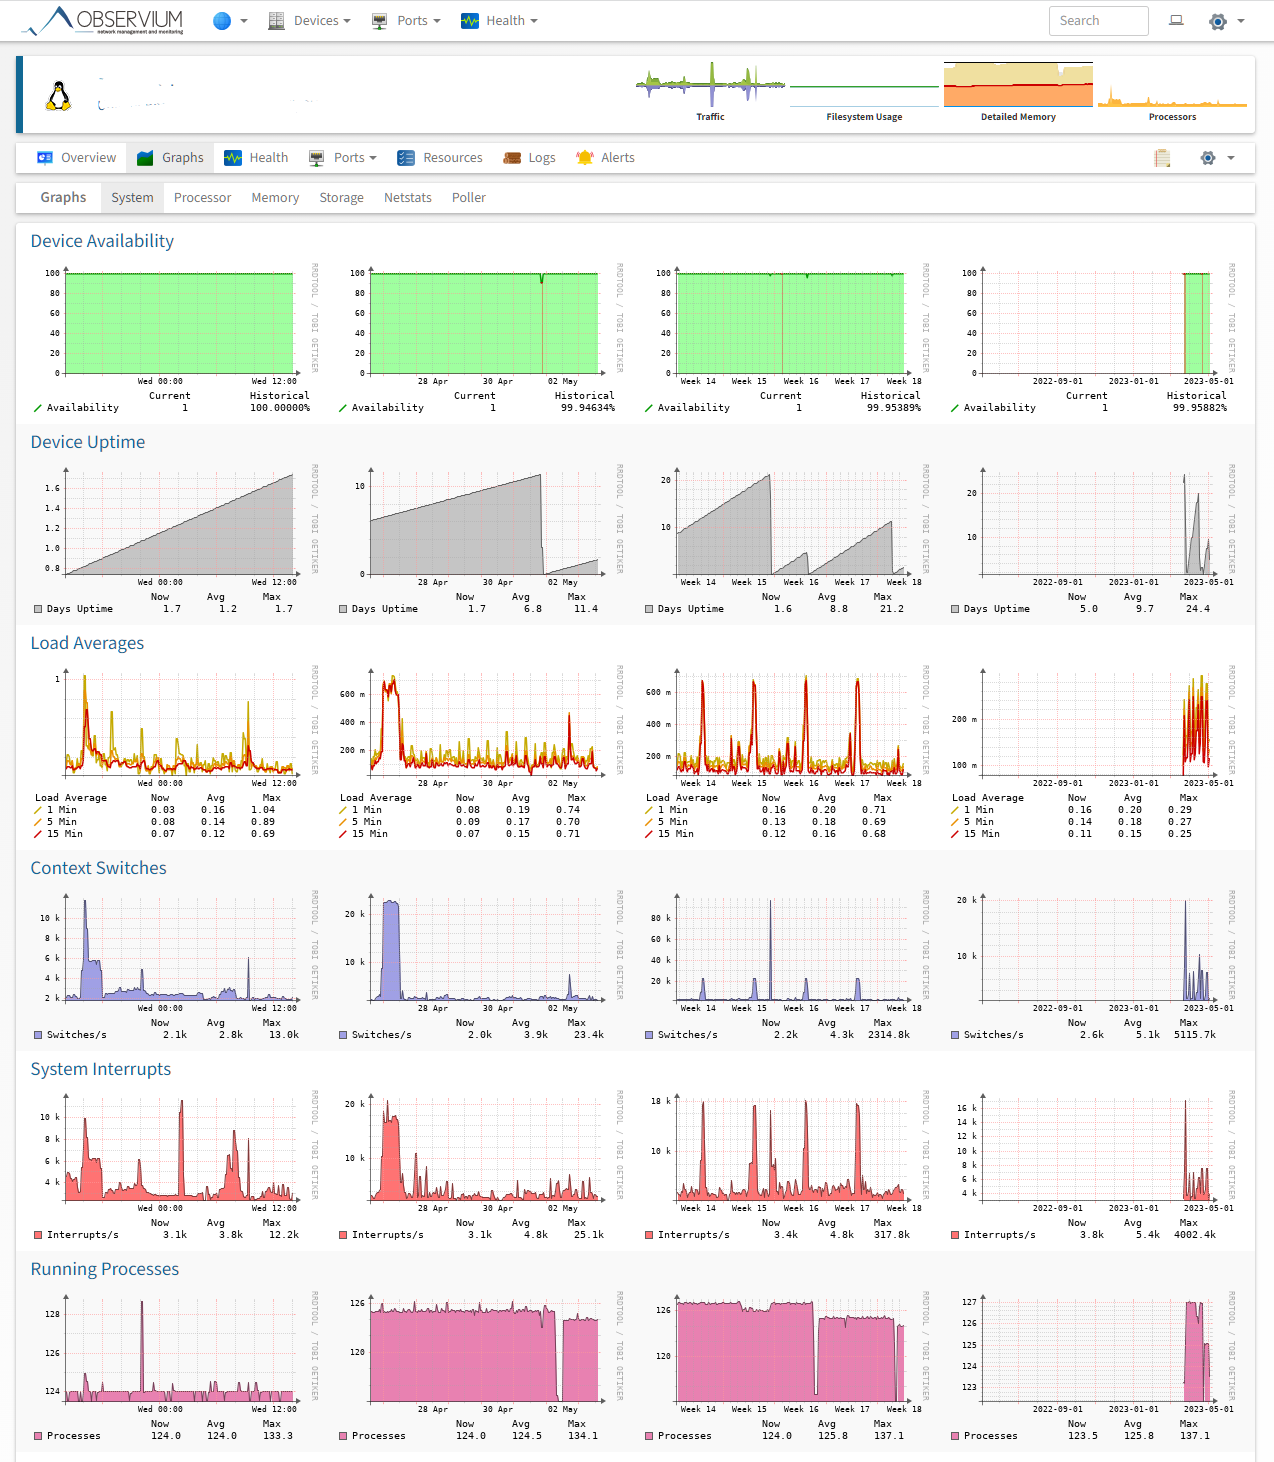
Another good alternative, which you can also install on premise, is Observium.
No need for agents to be installed or configured. Just using SNMP.
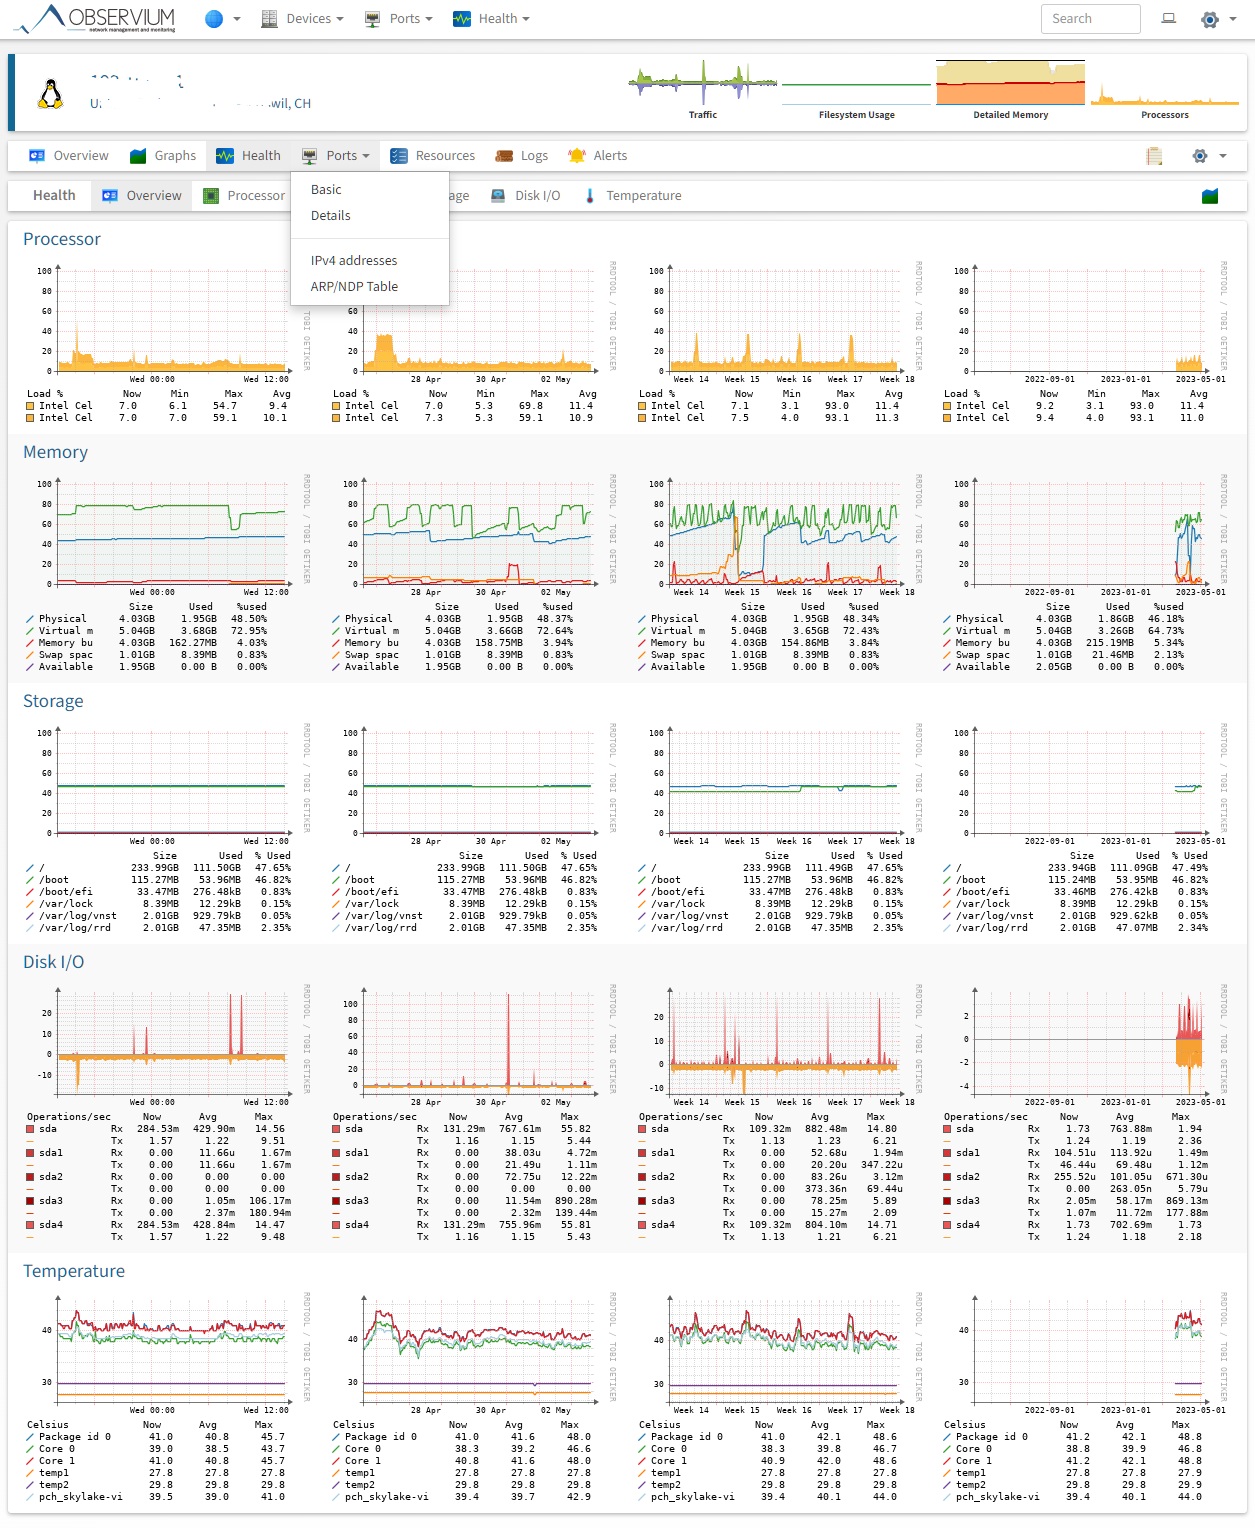
My Ipfire System dash:
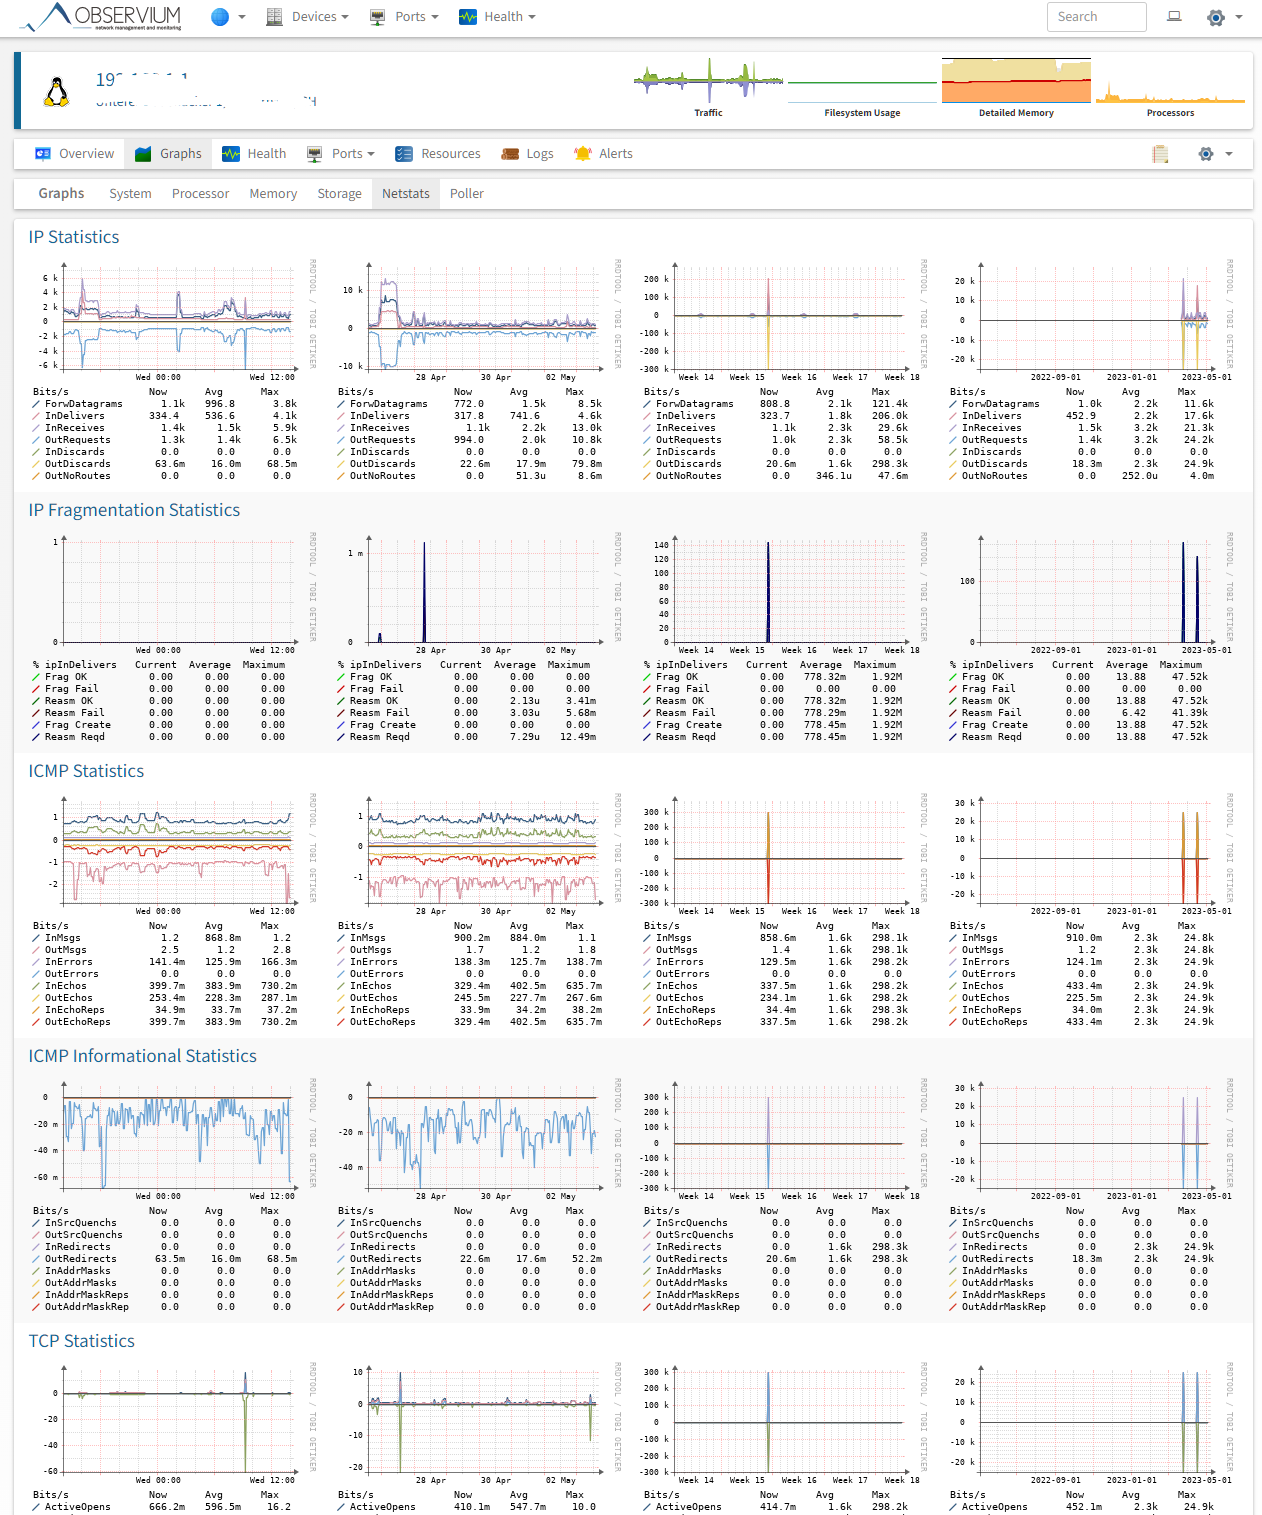
My Ipfire Netstats dash:
My Ipfire Health Overview page:
I also have Syslog and eventlog messages in there
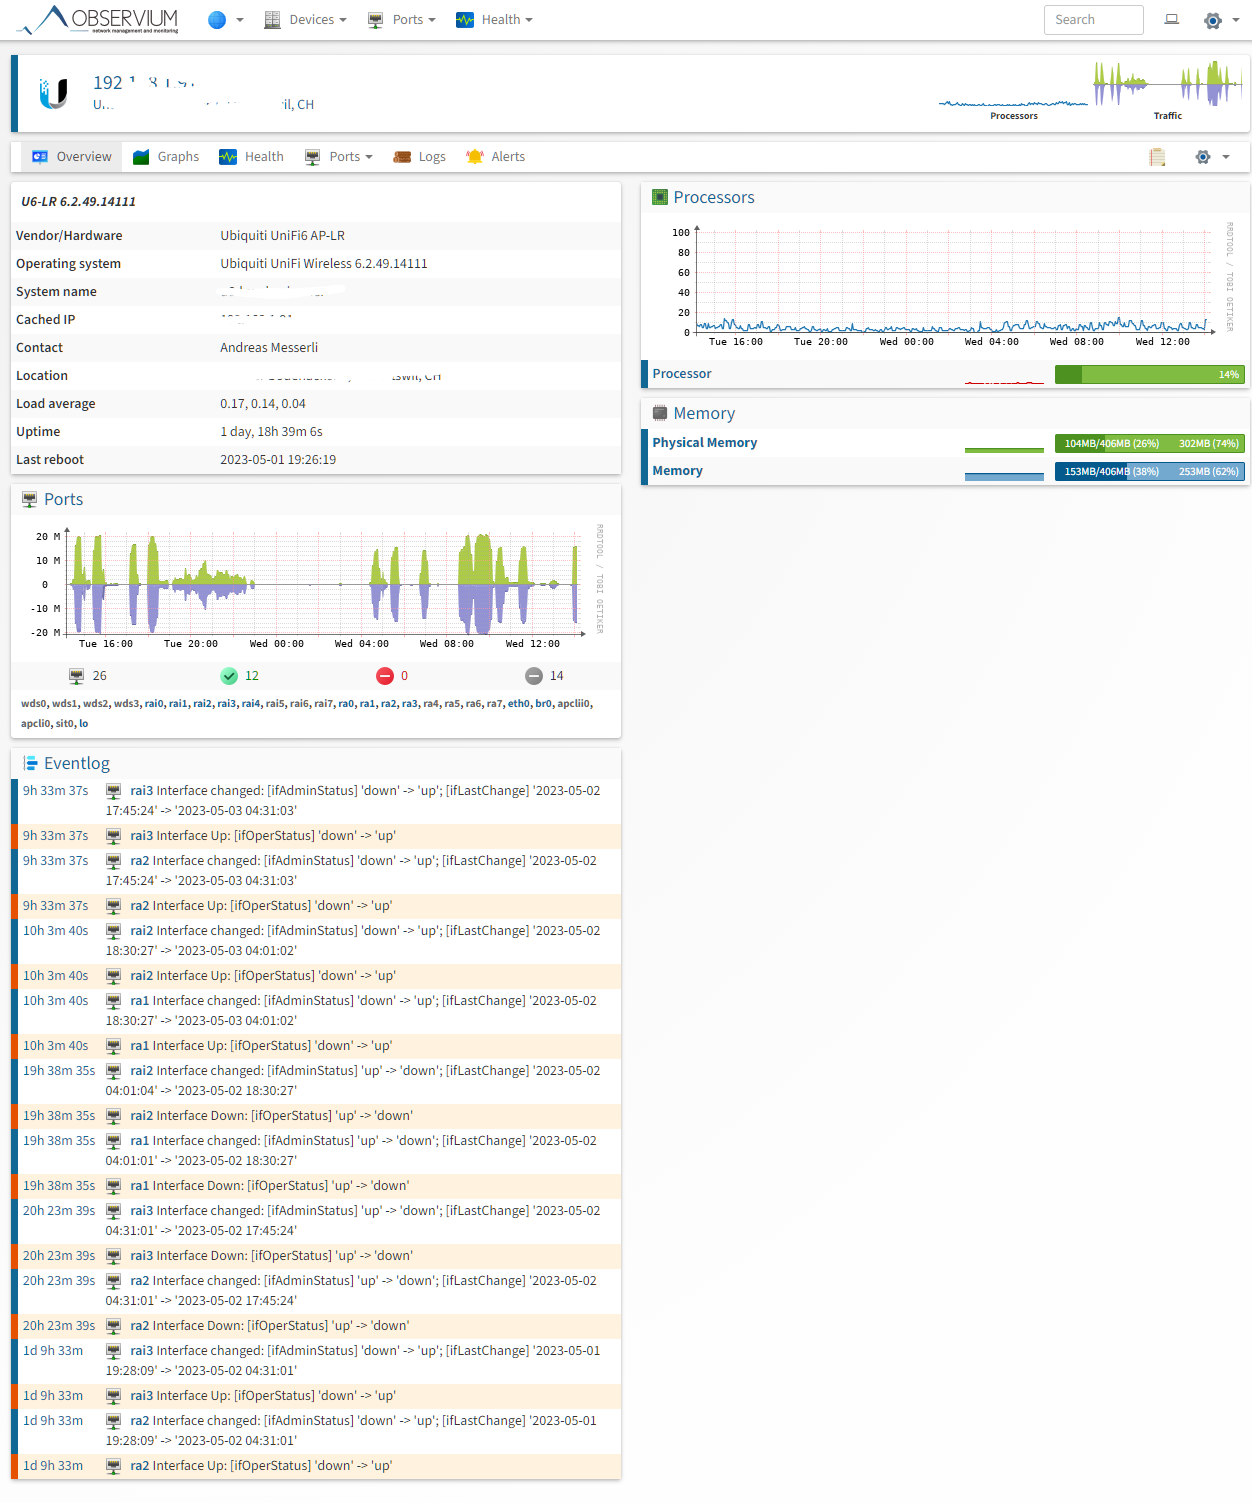
Observium is really a powerful tool and requires really low configuration. All it requires is snmp installed which is simply done on Linux and on most industrial grade hardware already preinstalled to be used. Like for example on Unify devices:
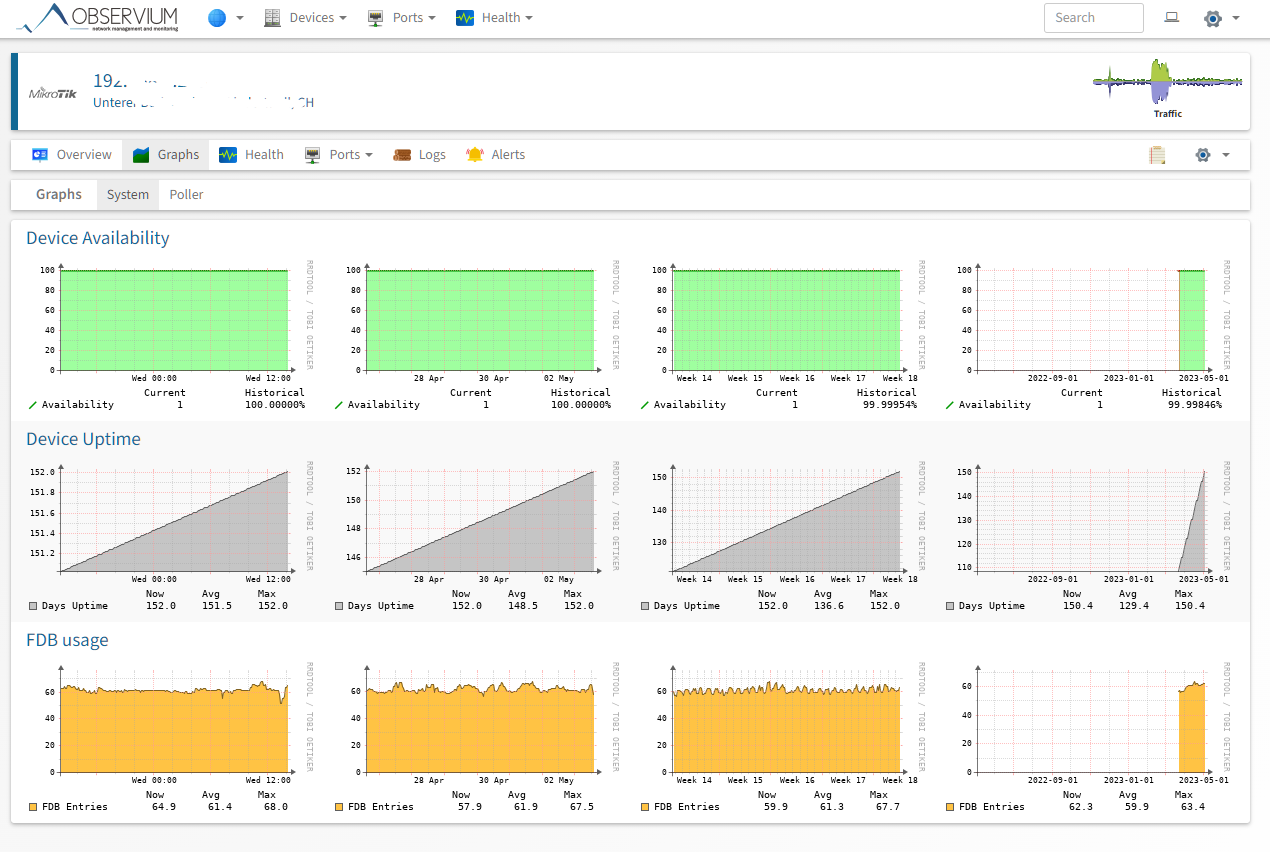
or Mikrotik Devices:
I monitor like this my IPcams, several QNAPs. Half a dozen IPFires ![]() WLAN APs from Unify and Draytek. All free and without agents as they use SNMP.
WLAN APs from Unify and Draytek. All free and without agents as they use SNMP.
Just as comparison to what you showed so that everyone can have a clue whats out there for monitoring.
And in the IPFire addons are Nagios, Icinga and Zabbix agents for monitoring.
There is also an Observium agent addon for IPFire even if it wasn’t needed by @firefox7518
Ehm… I would only like to chip in that as I understand it, CentOS is being scrapped, so no updates after 2024. Not a distro I would choose for just about anything.
https://blog.centos.org/2023/04/end-dates-are-coming-for-centos-stream-8-and-centos-linux-7/
Other than that, monitoring is cool and I thank you for posting this.
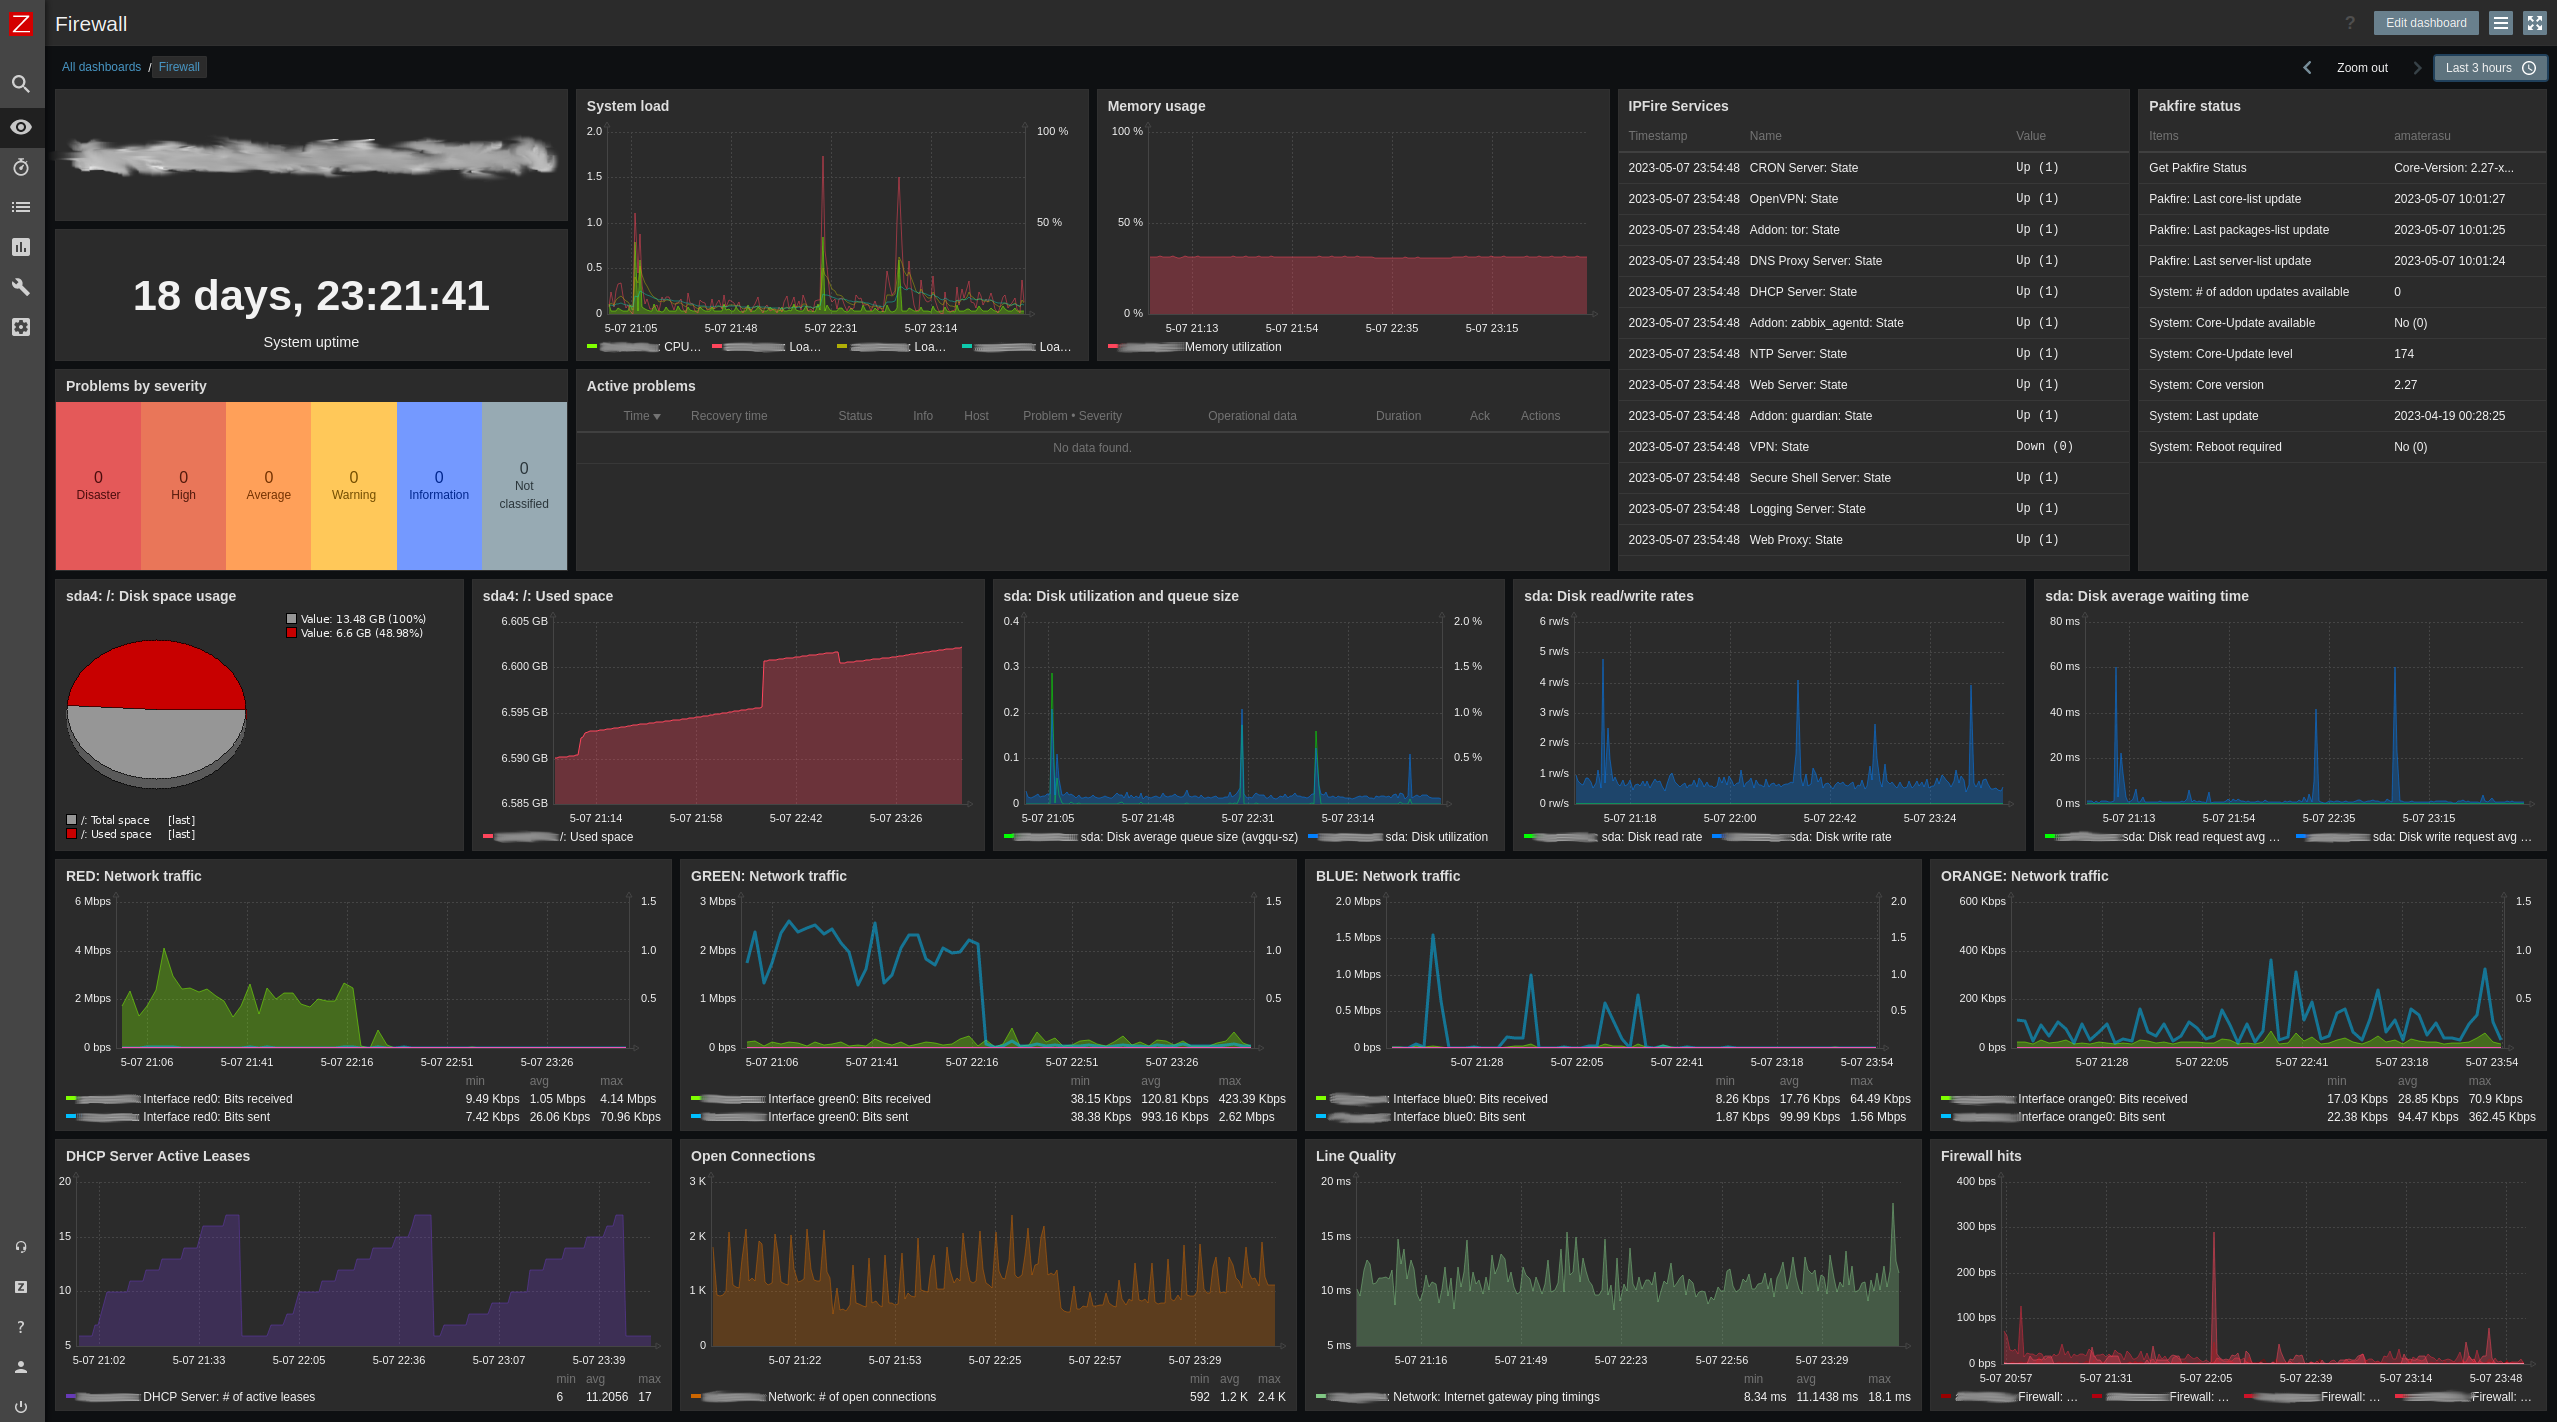
As we are sharing screenshots here, I might as well add a screenshot of my Zabbix IPFire dashboard, and promote using the Zabbix Agent addon included in IPFire (which I maintain) which is also configured out of the box to provide some extra IPFire specific metrics like Firewall hits, DHCP leases, Internet Gateway ping-times, Captive portal clients and Pakfire status.
See IPFire WIKI: Addons / Zabbix Agent for more information, installation and configuration instructions.
If you don’t already have a monitoring solution, I would strongly advice to make sure to at least checkout Zabbix.
It is enterprise grade, is fully open-source, is actively developed, supported and backed by a company and has packages for most commonly used distributions, docker-images, even helm charts for deployment on kubernetes and good documentation on how to set everything up and how to use it.
@robinr1 This looks fantastic. Congratulations and thanks for sharing it.
We use Zabbix at my former work and once I have my new server up and running I may very well look in to having it as monitoring solution.
Yet I wonder, is Netdata a competitor or do they work differently?
From viewing the website of Netdata, I would suspect that it is a competitor.
As a difference in how Netdata works notice that they offer more advanced features under paying subscription models; while at Zabbix, the CEO of the company makes it very clear in almost any presentation he gives, that Zabbix is completely open-source and free as in free beer and will always stay as such. There is only one flavor of Zabbix and it contains all features Zabbix has to offer for anyone to use.
They do however sell commercial support, trainings, certification and services for Zabbix to make a living.
From a functional point of view, I can’t argue for or against Netdata vs Zabbix as I don’t know Netdata and only learned about it’s existence just now ![]() . They seem to require host agents, as does Zabbix for easiest monitoring, however Zabbix can also call scripts, use SSH, query SNMP and receive traps (both SNMP and a custom Zabbix sender protocol), REST or SOAP interfaces, perform server-side tests, read prometheus metrics, etc… instead of using an agent. For you to find out if Netdata can do that too
. They seem to require host agents, as does Zabbix for easiest monitoring, however Zabbix can also call scripts, use SSH, query SNMP and receive traps (both SNMP and a custom Zabbix sender protocol), REST or SOAP interfaces, perform server-side tests, read prometheus metrics, etc… instead of using an agent. For you to find out if Netdata can do that too ![]() (I suppose so if it is any good of a monitoring tool)
(I suppose so if it is any good of a monitoring tool)
Robin… trying to figure out whether Zabbix could do website monitoring, as in visitor counts on an externally hosted website?
I am pretty sure it should be capable of monitoring uptime of said site, but traffic is another thing.
What do you think?
@sec-con: Your question is not really on topic, and should have been a PM, I think, as it is also not IPFire related. Or for the Zabbix forums.
To briefly answer you question: Zabbix can take in any series of data. If you can create a script, program or website-api or page to return a value like a current visitor count or a visitor count since xx up until now. You can send it to Zabbix, or let Zabbix, or the Agent execute it at set intervals. Zabbix can do calculations/mutations (preprocessing) on the incoming data and store it and show it on graphs… (and react and/or report on it) So it is entirely possible. But the logic on how to get a number of visitors on a website, will have to come from somewhere else.
oki, thanks
Should have searched instead of ask: https://blog.zabbix.com/whats-up-home-monitor-your-website-visitor-rate/25660/