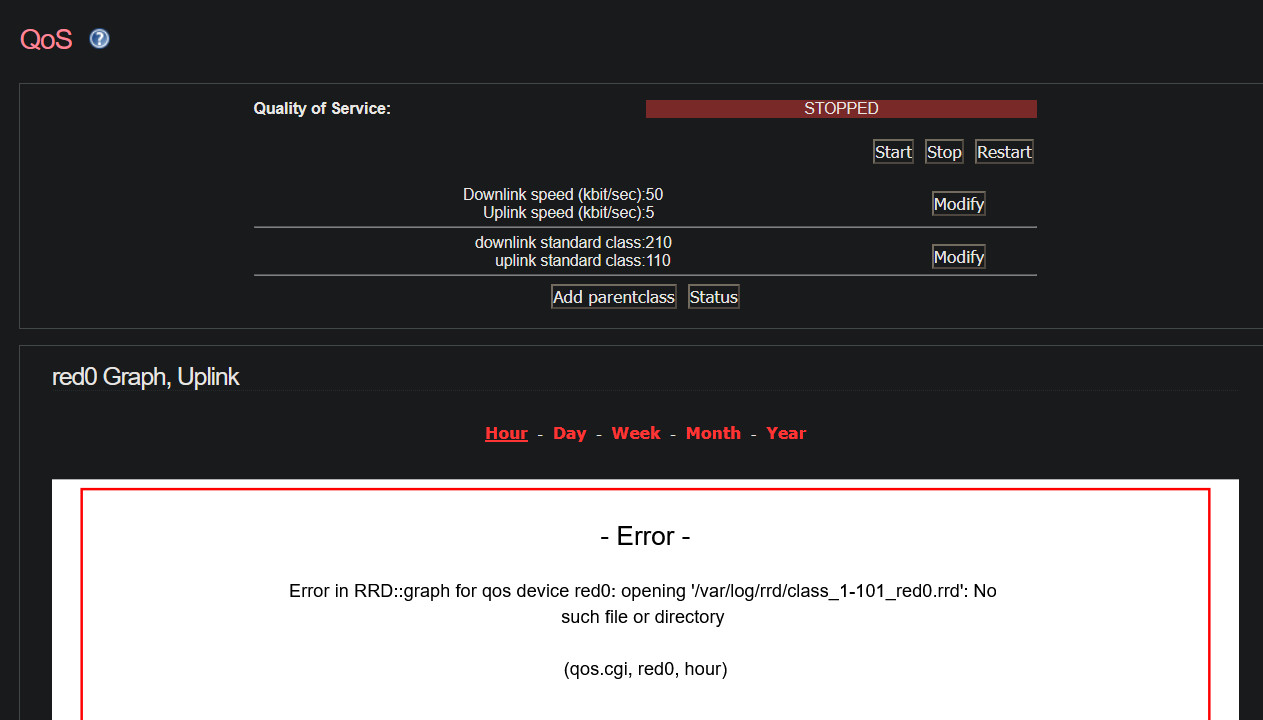
I noticed this strange error in the log
ipfire: Error in RRD::graph for qos device red0: opening ‘/var/log/rrd/class_1-101_red0. rrd’: No such file or directory (qos.cgi, red0, hour)
I noticed this strange error in the log
ipfire: Error in RRD::graph for qos device red0: opening ‘/var/log/rrd/class_1-101_red0. rrd’: No such file or directory (qos.cgi, red0, hour)
Hi,
what IPFire version are you running on? Did this happen after upgrading to Core Update 163?
Thanks, and best regards,
Peter Müller
I am running the latest IPFire
IPFire 2.27 (x86_64) - Core Update 163
it happened few days after the upgrade.
I think only after I click on Services- Quality of Service
If I don’t click on that, it will not cause an error
Hi,
sorry for the late reply.
Hm. I have never seen this error message before, and fail to reproduce it on any of the IPFire installations I have access to.
Just to ensure: Did you sometimes installed a testing Core Update on the affected machine? If so, maybe there is something left from the testing version of Core Update 163, causing this error.
Thanks, and best regards,
Peter Müller
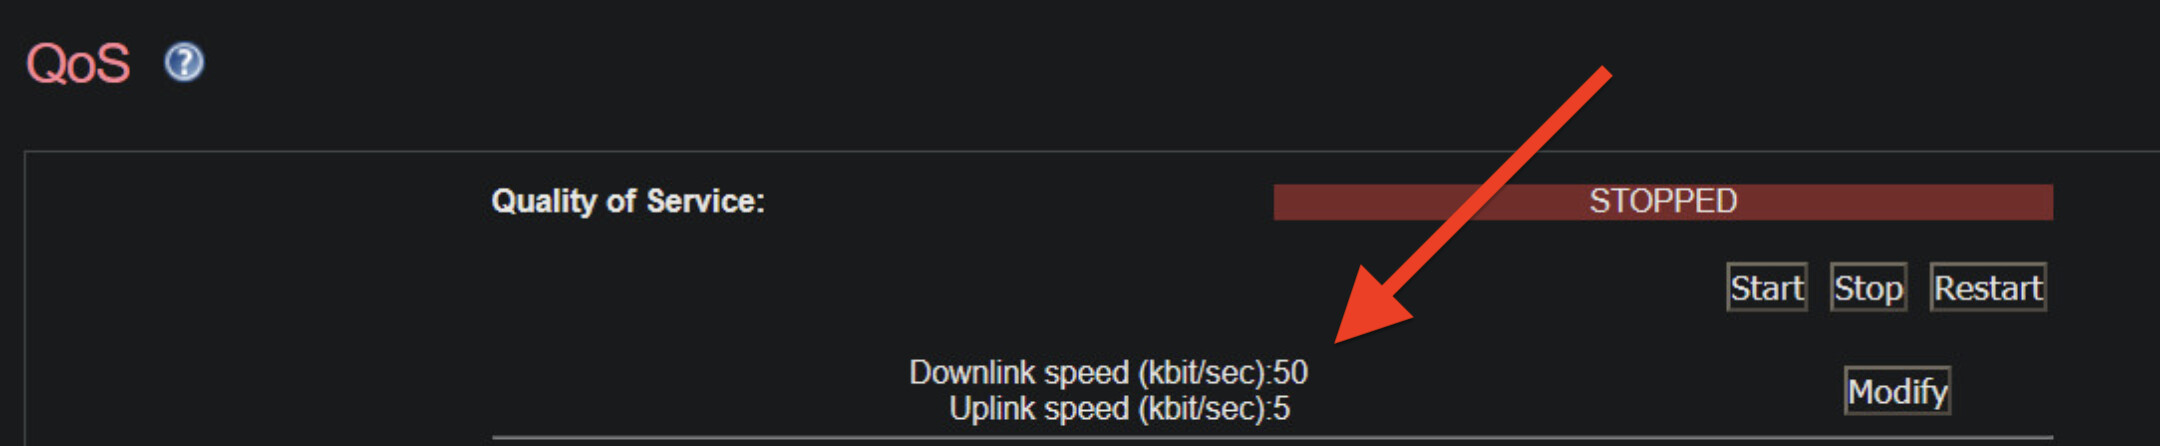
As a side thought and not related to the - Error -
Your Downlink and Uplink speeds are painfully slow!
I don’t know your internet speeds but assuming you have 50 Mbps by 5 Mbps then you are missing three zeros. Maybe this is more correct?
Downlink speed (kbit/sec): 50000
Uplink speed (kbit/sec): 5000
No problem Peter, yes, It is possible something is left from the testing version.
The only issue I noticed is the entry in the log,
The speed actually goes to ZERO when you Start the QoS service.
Interesting , I think the 50 and 5 were default values, I don’t think I changed those.
Hi,
oh well, I was missing something really basic here: Your QoS is turned off. ![]()
That way, no RRD statistic files are written, so there is no data for collectd (the program generating all those graphs) to analyse and display.
Therefore, this is not a bug. It it ugly, but works as designed.
Now, if you enable QoS again, wait a few minutes (around 5 should be enough), and then still don’t see any hourly graph, that would be a bug we need to take care about. ![]()
Thanks, and best regards,
Peter Müller
Last time I Started QOS, it completely “disabled” the firewall
No traffic was able to go in or out. Not even DNS. It felt like WAN network is completely down.
Hi,
so, even after running the latest Core Update and adjusting the bandwidth settings, enabling QoS causes your network to be rendered unusable?
If so, this would be something we will have to look at indeed then. ![]()
If not, may I ask you to try again with the corrected bandwidth settings, and see if the graph is generated correctly?
Thanks, and best regards,
Peter Müller
4 posts were merged into an existing topic: QOS Graphs not working in 175