hi there.
this is about some other type of addon - entware - well known for small devices like routers, nas devices ond so ones…
Also: The IPFIRE hardware usage is relatively nice shown in gui, but not quick enough - sometimes it is one second step resolution (live mode) needed to show something usefull - and htop shows too little about other things in running system - and I have installed nmon on some QNAP NAS devices successfully, or NETGEAR NAS devices… for same reason - live usage of resources…
Let’s go:
1st rule - BACKUP to ISO and download it out from IPFIRE !!! before running not proven things…
I have classic notebook with x64 cpu inside manged from far windows machine - it is the latest version of - IPFire 2.27 (x86_64) - Core Update 168 - also I have used x86_64 generic.sh installation script from here:
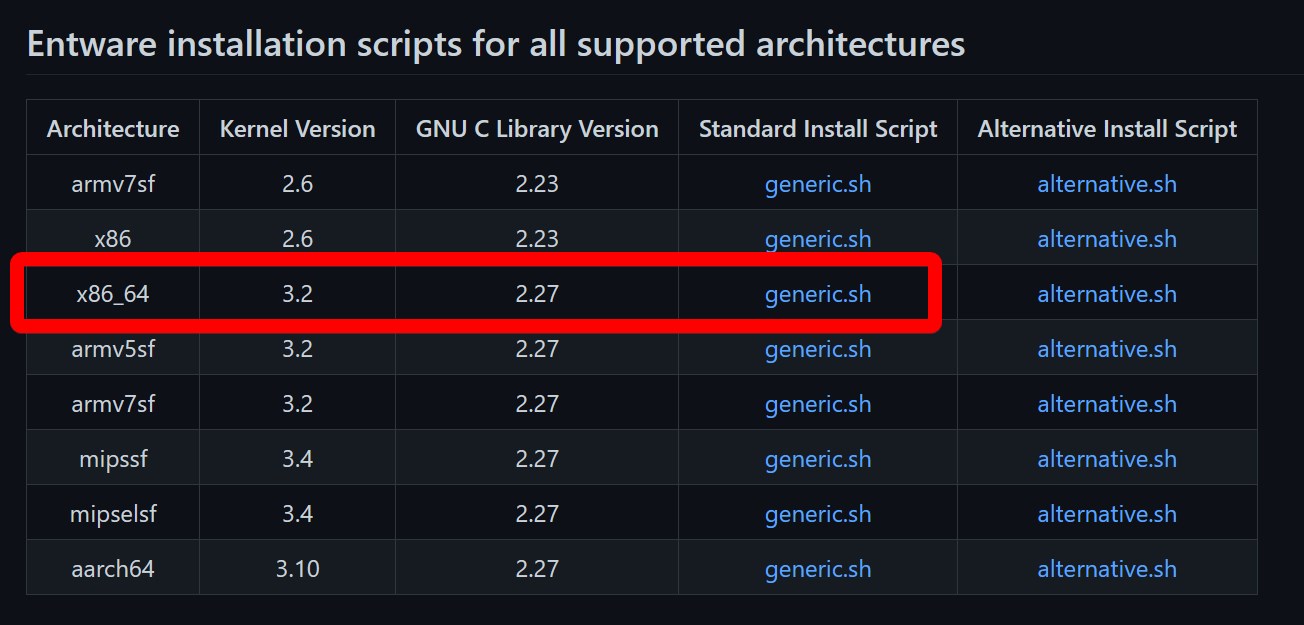
download and put them into /opt/ directory
then run command “sh generic.sh” in that /opt/ directory
- it should report no errors (what it should report and what it does is in the generic.sh - also U can read it there…)
then run command “/opt/etc/init.d/rc.unslung start” (but don’t know if it was needed… no feedback) but it was in one article so I have done it ![]()
logout from cli
then changed putty terminal options:
connection → data → terminal details → terminal-type string → from “putty” to “xterm”
(have had errors when not)
window → translation → Adjust line drawing → enable “VT100 line drawing even in UTF-8 mode”
(nmon draws correct lines around sections, midnight commander “mc” also uses this sometimes)
then log in back
then run command “/opt/bin/opkg update”
then run command “/opt/bin/opkg upgrade”
then package installation “/opt/bin/opkg install nmon”
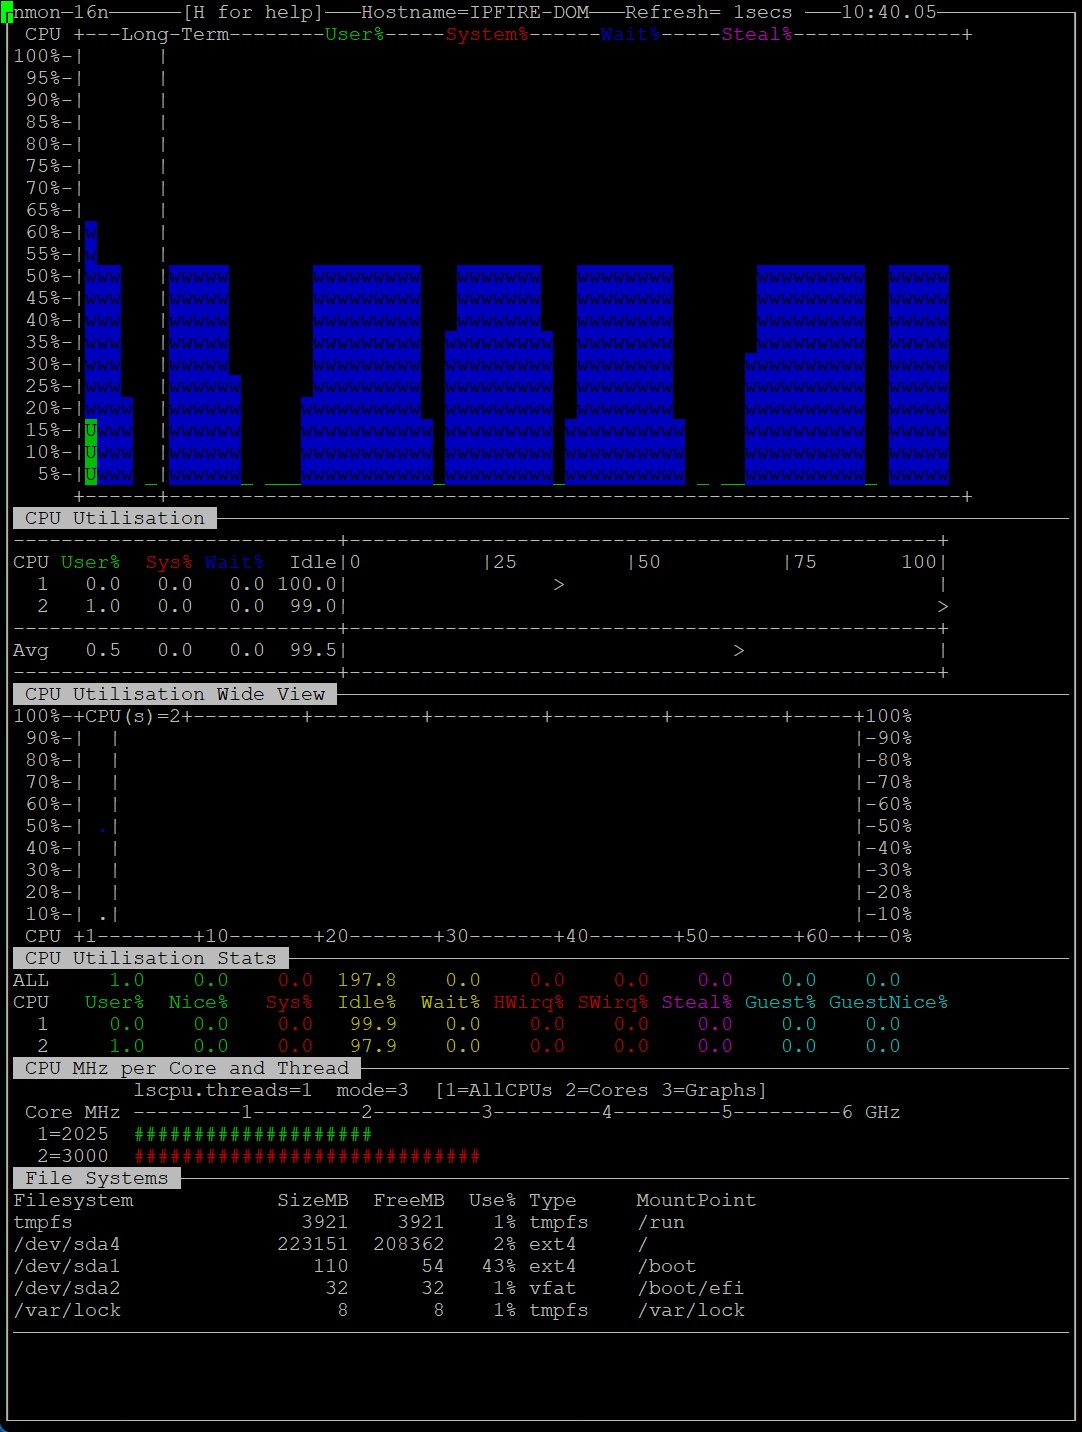
and the last one - running nmon by: “/opt/bin/nmon”
I like options (after running nmon by pressing these letters on kb):
cCUljJMMM-
c = CPU Util
C = CPU wide view
U = CPU Utilisation Stats (not in h [help] shown)
l = (small L) longer term CPU averages
j = Filesystem Usage
J = reduced Filesystem Usage
M = MHz by thread & CPU
next M & M to show it like graphs… (read second row after header)
good luck !