Hi @All,
I suddenly have massive problems with the DNS Lokoop. I’ve read some Thrades about similar problems here, but thei are all not exctly the same.
But in order:
I have in my NEtzwerk an own DNS small DNS resolver (pihole) which normally does the name resolution as a reverse proxy. This is distributed via DHCP as Primary DNS. The ipfire itself also has the DNS resolver running and is distributed as seconday. The Idea is just to use the pihole in standardcase, but to have a backup, when it’s not running.
Now suddenly the name resolution doesn’t work anywhere in die LAN.
A typical picture is this:
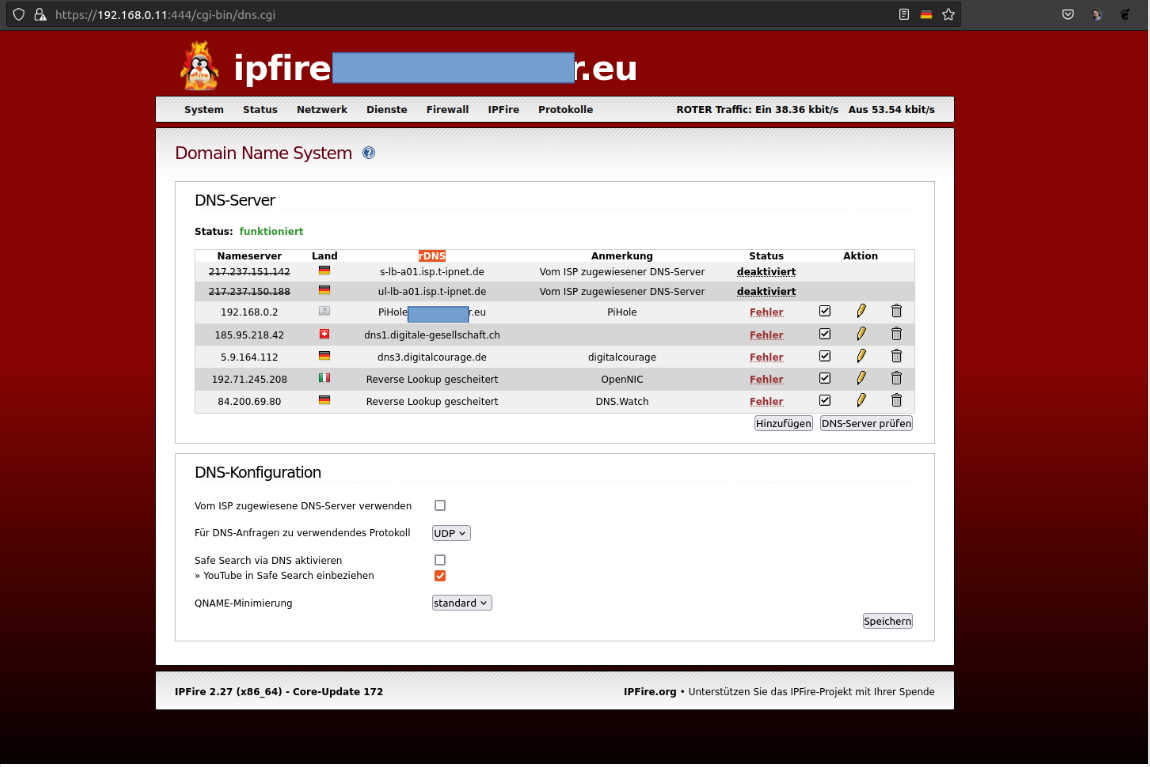
If you move the mouse over “Error” it says something like: “Response timeout for 5.9.164.112@53 (UDP)”.
The DNS log is full of such entries:
22:03:52	unbound: [1690:0]	error: SERVFAIL <footprints-pa.googleapis.com.von-der-haar.eu. A IN>: all the c onfigured stub or forward servers failed, at zone . no server to query nameserve r addresses not usable have no nameserver names
22:03:53 unbound: [1690:0] error: SERVFAIL <www.google.com. AAAA IN>: all the configured stub or forward s ervers failed, at zone . no server to query nameserver addresses not usable have no nameserver names
Then there is a block like this in between:
2:03:53	unbound: [1690:0]	error: read (in tcp s): Connection timed out for 217.237.150.188 port 53
22:04:04	unbound: [1690:0]	error: read (in tcp s): Connection timed out for 5.9.164.112 port 53
22:04:19	unbound: [1690:0]	error: read (in tcp s): Connection timed out for 5.9.164.112 port 53
22:04:35	unbound: [1690:0]	error: read (in tcp s): Connection timed out for 5.9.164.112 port 53
22:04:50	unbound: [1690:0]	error: read (in tcp s): Connection timed out for 5.9.164.112 port 53
22:05:06	unbound: [1690:0]	error: read (in tcp s): Connection timed out for 5.9.164.112 port 53
22:05:21	unbound: [1690:0]	error: read (in tcp s): Connection timed out for 5.9.164.112 port 53
22:05:36	unbound: [1690:0]	error: read (in tcp s): Connection timed out for 5.9.164.112 port 53
22:05:52	unbound: [1690:0]	error: read (in tcp s): Connection timed out for 5.9.164.112 port 53
22:05:52	unbound: [1690:0]	error: read (in tcp s): Connection timed out for 185.95.218.42 port 53
22:06:07	unbound: [1690:0]	error: read (in tcp s): Connection timed out for 5.9.164.112 port 53
22:06:07	unbound: [1690:0]	error: read (in tcp s): Connection timed out for 185.95.218.42 port 53
22:06:22	unbound: [1690:0]	error: read (in tcp s): Connection timed out for 5.9.164.112 port 53
22:06:29	unbound: [1690:0]	info: service stopped (unbound 1.17.0).
22:06:29	unbound: [1690:0]	info: server stats for thread 0: 2036 queries, 1004 answers from cache, 1032 re cursions, 199 prefetch, 0 rejected by ip ratelimiting
22:06:29	unbound: [1690:0]	info: server stats for thread 0: requestlist max 34 avg 21.6304 exceeded 0 jost led 0
22:06:29	unbound: [1690:0]	info: average recursion processing time 45.430946 sec
22:06:29	unbound: [1690:0]	info: histogram of recursion processing times
22:06:29	unbound: [1690:0]	info: [25%]=8.64316e-07 median[50%]=3.15385 [75%]=60.0952
22:06:29	unbound: [1690:0]	info: lower(secs) upper(secs) recursions
22:06:29	unbound: [1690:0]	info: 0.000000 0.000001 234
22:06:29	unbound: [1690:0]	info: 0.002048 0.004096 2
22:06:29	unbound: [1690:0]	info: 0.008192 0.016384 45
22:06:29	unbound: [1690:0]	info: 0.016384 0.032768 26
22:06:29	unbound: [1690:0]	info: 0.032768 0.065536 34
22:06:29	unbound: [1690:0]	info: 0.065536 0.131072 24
22:06:29	unbound: [1690:0]	info: 0.131072 0.262144 11
22:06:29	unbound: [1690:0]	info: 0.262144 0.524288 4
22:06:29	unbound: [1690:0]	info: 0.524288 1.000000 10
22:06:29	unbound: [1690:0]	info: 1.000000 2.000000 7
22:06:29	unbound: [1690:0]	info: 2.000000 4.000000 13
22:06:29	unbound: [1690:0]	info: 4.000000 8.000000 29
22:06:29	unbound: [1690:0]	info: 8.000000 16.000000 42
22:06:29	unbound: [1690:0]	info: 16.000000 32.000000 52
22:06:29	unbound: [1690:0]	info: 32.000000 64.000000 84
22:06:29	unbound: [1690:0]	info: 64.000000 128.000000 96
22:06:29	unbound: [1690:0]	info: 128.000000 256.000000 63
22:06:29	unbound: [1690:0]	info: 256.000000 512.000000 33
22:06:29	unbound: [1690:0]	notice: Restart of unbound 1.17.0.
22:06:29	unbound: [1690:0]	notice: init module 0: validator
22:06:29	unbound: [1690:0]	notice: init module 1: iterator
22:06:29	unbound: [1690:0]	info: start of service (unbound 1.17.0).
22:06:33	unbound: [1690:0]	info: generate keytag query _ta-4a5c-4f66. NULL IN
22:08:04	unbound: [1690:0]	info: service stopped (unbound 1.17.0).
22:08:04	unbound: [1690:0]	info: server stats for thread 0: 54 queries, 18 answers from cache, 36 recursio ns, 2 prefetch, 0 rejected by ip ratelimiting
22:08:04	unbound: [1690:0]	info: server stats for thread 0: requestlist max 4 avg 0.842105 exceeded 0 jost led 0
22:08:04	unbound: [1690:0]	info: average recursion processing time 1.417473 sec
22:08:04	unbound: [1690:0]	info: histogram of recursion processing times
22:08:04	unbound: [1690:0]	info: [25%]=0.032768 median[50%]=0.057344 [75%]=0.393216
22:08:04	unbound: [1690:0]	info: lower(secs) upper(secs) recursions
22:08:04	unbound: [1690:0]	info: 0.000000 0.000001 1
22:08:04	unbound: [1690:0]	info: 0.008192 0.016384 5
22:08:04	unbound: [1690:0]	info: 0.016384 0.032768 3
22:08:04	unbound: [1690:0]	info: 0.032768 0.065536 12
22:08:04	unbound: [1690:0]	info: 0.065536 0.131072 3
22:08:04	unbound: [1690:0]	info: 0.131072 0.262144 2
22:08:04	unbound: [1690:0]	info: 0.262144 0.524288 2
22:08:04	unbound: [1690:0]	info: 1.000000 2.000000 1
22:08:04	unbound: [1690:0]	info: 2.000000 4.000000 3
22:08:04	unbound: [1690:0]	info: 4.000000 8.000000 1
22:08:04	unbound: [1690:0]	info: 8.000000 16.000000 3
22:08:04	unbound: [1690:0]	notice: Restart of unbound 1.17.0.
22:08:04	unbound: [1690:0]	notice: init module 0: validator
22:08:04	unbound: [1690:0]	notice: init module 1: iterator
22:08:04	unbound: [1690:0]	info: start of service (unbound 1.17.0).
22:08:08	unbound: [1690:0]	info: generate keytag query _ta-4a5c-4f66. NULL IN
22:08:36	unbound: [1690:0]	info: service stopped (unbound 1.17.0).
22:08:36	unbound: [1690:0]	info: server stats for thread 0: 14 queries, 2 answers from cache, 12 recursion s, 0 prefetch, 0 rejected by ip ratelimiting
22:08:36	unbound: [1690:0]	info: server stats for thread 0: requestlist max 4 avg 0.916667 exceeded 0 jost led 0
22:08:36	unbound: [1690:0]	info: average recursion processing time 2.332612 sec
22:08:36	unbound: [1690:0]	info: histogram of recursion processing times
22:08:36	unbound: [1690:0]	info: [25%]=0.032768 median[50%]=0.131072 [75%]=3.5
22:08:36	unbound: [1690:0]	info: lower(secs) upper(secs) recursions
22:08:36	unbound: [1690:0]	info: 0.008192 0.016384 1
22:08:36	unbound: [1690:0]	info: 0.016384 0.032768 2
22:08:36	unbound: [1690:0]	info: 0.032768 0.065536 2
22:08:36	unbound: [1690:0]	info: 0.065536 0.131072 1
22:08:36	unbound: [1690:0]	info: 2.000000 4.000000 4
22:08:36	unbound: [1690:0]	info: 4.000000 8.000000 1
22:08:36	unbound: [1690:0]	info: 8.000000 16.000000 1
22:08:36	unbound: [1690:0]	notice: Restart of unbound 1.17.0.
22:08:36	unbound: [1690:0]	notice: init module 0: validator
22:08:36	unbound: [1690:0]	notice: init module 1: iterator
22:08:36	unbound: [1690:0]	info: start of service (unbound 1.17.0).
22:08:41	unbound: [1690:0]	info: generate keytag query _ta-4a5c-4f66. NULL IN
22:09:10	unbound: [1690:0]	info: service stopped (unbound 1.17.0).
22:09:10	unbound: [1690:0]	info: server stats for thread 0: 32 queries, 12 answers from cache, 20 recursio ns, 0 prefetch, 0 rejected by ip ratelimiting
22:09:10	unbound: [1690:0]	info: server stats for thread 0: requestlist max 4 avg 1.8 exceeded 0 jostled 0
22:09:10	unbound: [1690:0]	info: average recursion processing time 3.299054 sec
22:09:10	unbound: [1690:0]	info: histogram of recursion processing times
22:09:10	unbound: [1690:0]	info: [25%]=0.32768 median[50%]=1 [75%]=5
22:09:10	unbound: [1690:0]	info: lower(secs) upper(secs) recursions
22:09:10	unbound: [1690:0]	info: 0.000000 0.000001 1
22:09:10	unbound: [1690:0]	info: 0.065536 0.131072 2
22:09:10	unbound: [1690:0]	info: 0.131072 0.262144 1
22:09:10	unbound: [1690:0]	info: 0.262144 0.524288 4
22:09:10	unbound: [1690:0]	info: 0.524288 1.000000 2
22:09:10	unbound: [1690:0]	info: 1.000000 2.000000 3
22:09:10	unbound: [1690:0]	info: 2.000000 4.000000 1
22:09:10	unbound: [1690:0]	info: 4.000000 8.000000 4
22:09:10	unbound: [1690:0]	info: 8.000000 16.000000 1
22:09:10	unbound: [1690:0]	info: 16.000000 32.000000 1
22:09:10	unbound: [1690:0]	notice: Restart of unbound 1.17.0.
22:09:10	unbound: [1690:0]	notice: init module 0: validator
22:09:10	unbound: [1690:0]	notice: init module 1: iterator
22:09:10	unbound: [1690:0]	info: start of service (unbound 1.17.0).
22:09:23	unbound: [1690:0]	info: generate keytag query _ta-4a5c-4f66. NULL IN
22:18:13	unbound: [1690:0]	info: service stopped (unbound 1.17.0).
22:18:13	unbound: [1690:0]	info: server stats for thread 0: 129 queries, 46 answers from cache, 83 recursi ons, 2 prefetch, 0 rejected by ip ratelimiting
22:18:13	unbound: [1690:0]	info: server stats for thread 0: requestlist max 5 avg 0.505882 exceeded 0 jost led 0
22:18:13	unbound: [1690:0]	info: average recursion processing time 0.850413 sec
22:18:13	unbound: [1690:0]	info: histogram of recursion processing times
22:18:13	unbound: [1690:0]	info: [25%]=0.189046 median[50%]=0.423005 [75%]=0.801787
22:18:13	unbound: [1690:0]	info: lower(secs) upper(secs) recursions
22:18:13	unbound: [1690:0]	info: 0.000000 0.000001 1
22:18:13	unbound: [1690:0]	info: 0.065536 0.131072 14
22:18:13	unbound: [1690:0]	info: 0.131072 0.262144 13
22:18:13	unbound: [1690:0]	info: 0.262144 0.524288 22
22:18:13	unbound: [1690:0]	info: 0.524288 1.000000 21
22:18:13	unbound: [1690:0]	info: 1.000000 2.000000 6
22:18:13	unbound: [1690:0]	info: 2.000000 4.000000 3
22:18:13	unbound: [1690:0]	info: 4.000000 8.000000 1
22:18:13	unbound: [1690:0]	info: 8.000000 16.000000 2
22:18:13	unbound: [1690:0]	notice: Restart of unbound 1.17.0.
22:18:13	unbound: [1690:0]	notice: init module 0: validator
22:18:13	unbound: [1690:0]	notice: init module 1: iterator
22:18:13	unbound: [1690:0]	info: start of service (unbound 1.17.0).
22:18:13	unbound: [1690:0]	info: generate keytag query _ta-4a5c-4f66. NULL IN
22:26:56	unbound: [1690:0]	info: service stopped (unbound 1.17.0).
22:26:56	unbound: [1690:0]	info: server stats for thread 0: 194 queries, 76 answers from cache, 118 recurs ions, 2 prefetch, 0 rejected by ip ratelimiting
22:26:56	unbound: [1690:0]	info: server stats for thread 0: requestlist max 5 avg 0.508333 exceeded 0 jost led 0
22:26:56	unbound: [1690:0]	info: average recursion processing time 0.706079 sec
22:26:56	unbound: [1690:0]	info: histogram of recursion processing times
22:26:56	unbound: [1690:0]	info: [25%]=0.112474 median[50%]=0.198379 [75%]=0.412877
22:26:56	unbound: [1690:0]	info: lower(secs) upper(secs) recursions
22:26:56	unbound: [1690:0]	info: 0.000000 0.000001 3
22:26:56	unbound: [1690:0]	info: 0.065536 0.131072 37
22:26:56	unbound: [1690:0]	info: 0.131072 0.262144 37
22:26:56	unbound: [1690:0]	info: 0.262144 0.524288 20
22:26:56	unbound: [1690:0]	info: 0.524288 1.000000 13
22:26:56	unbound: [1690:0]	info: 1.000000 2.000000 7
22:26:56	unbound: [1690:0]	info: 32.000000 64.000000 1
22:26:56	unbound: [1690:0]	notice: Restart of unbound 1.17.0.
22:26:56	unbound: [1690:0]	notice: init module 0: validator
22:26:56	unbound: [1690:0]	notice: init module 1: iterator
22:26:56	unbound: [1690:0]	info: start of service (unbound 1.17.0).
22:27:02	unbound: [1690:0]	info: generate keytag query _ta-4a5c-4f66. NULL IN
in the IPS log there are quite a few messages like this one here:
Date: 02/03 22:08:08 Name: SURICATA STREAM 3way handshake SYNACK with wrong ack
Priority: 3 Type: Unknown Classtype
IP info: 217.237.150.188:53 -> 79.251.32.137:44238
References: nothing found SID: 2210007
So I disabled the intrusion prevention system for now. → No change.
Chaning the protocoll TCP/UDP doesn´t make any difference.
The internal DNS resolver claims that it works without any problems. (Or at least I can’t find anything to the contrary).