After the update to 176 I noticed that the average memory consumption went up from 8% to 22%.
I started with IPFire in January 2023 - and in 173 -175 it almost never went up above 15%
I did not do changes in the configuration.
Just to let you know.
The buffered and cached memory go down because of the reboot but the real used memory stays the same.
What do you see is consuming the most memory if you run top or htop? If you have run top or htop in the past Is there a particular application that has increased its memory consumption or is it spread across all applications?
Are you able to re-install Core Update 175 and take a shot of top or htop and then upgrade to CU 176 and re-do the test?
Ah, maybe my bad analysis.
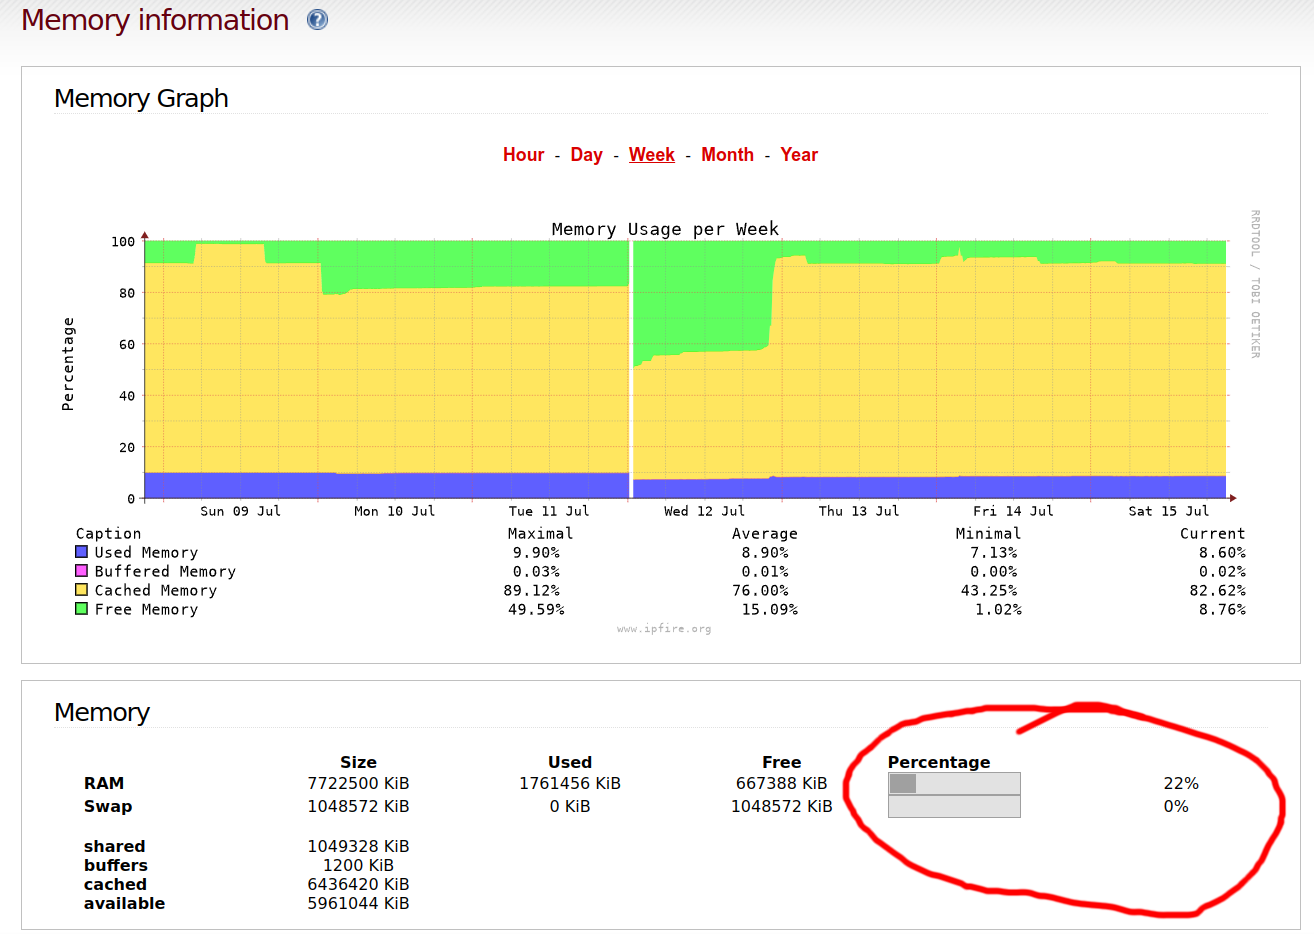
I was paying more attention to the Percentage, which stated only 8% before the upgrade.
But from the total graph that would not hold true.
The Memory box of the page shows the actual situation. Even with a mean value of 9% there may be single values of 22%.
( simple example: 9 values of 7,5% and 1 value of 22% give a mean of 9% )
The poster was saying that the actual current situation in the percent box has been showing the 22% since the upgrade to CU176 happened.
That is then not a single measurement that would leave the mean at the lower value but an ongoing value of 20%.
Also I would then expect the Maximal % in the graph to show the 20% but it is just showing 9.90%
I would also expect the Current value in the graph to be close to the value next to the percentage bar, especially if the percentage bar has been showing 20% on an ongoing basis but the graph shows Current at 8.60% while the percentage var is 22%. That is too big a difference.
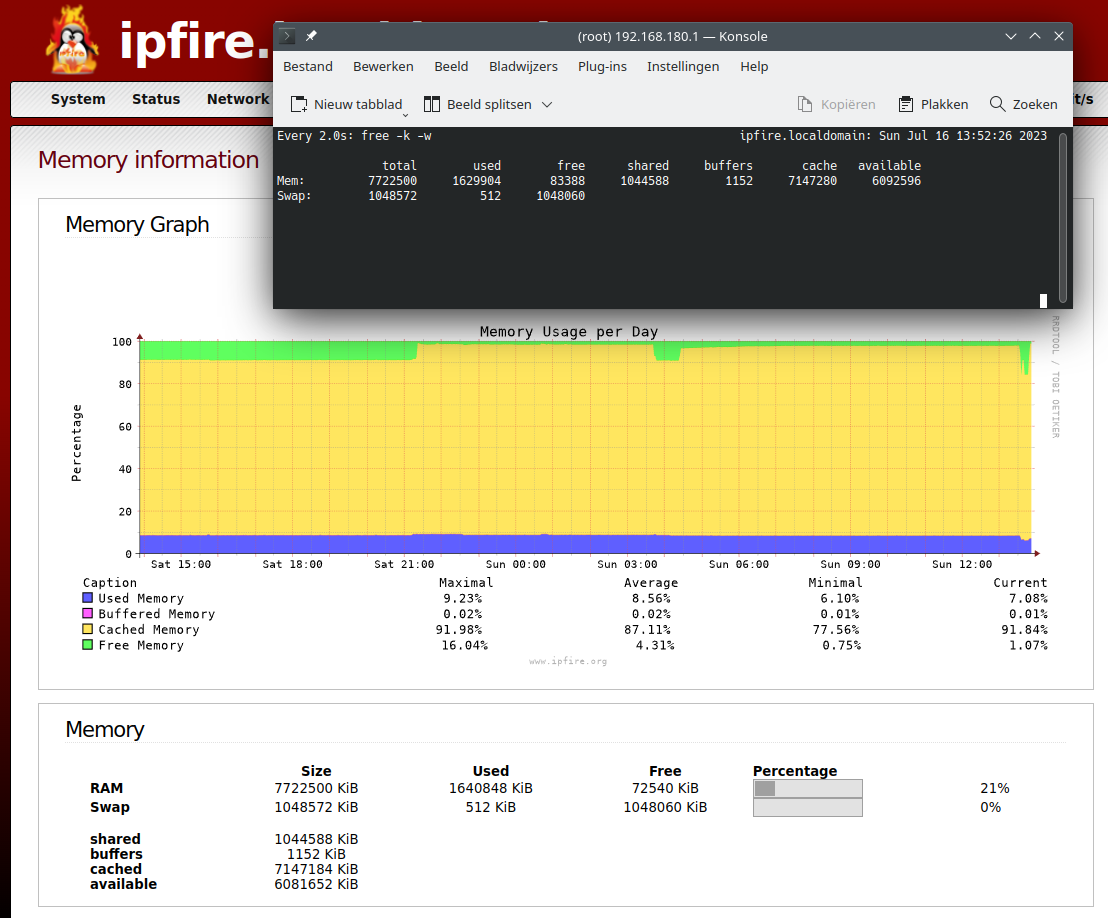
@zebulon what numbers do you get if you run free -k -w
in the IPFire terminal? They should be similar to the numbers in the Memory table section but obviously not precisely the same, as they are actual values and continuously changing.
Ok, I know what the problem is.
In IPFire I have KVM virtual maschine running. For some reason in 174 and 175 the memory summury did show 8% - but now it shows 22%.
If I shut the KVM virtual maschine off it show only 6%. For some reason the older release only showed the summury of IPFire and now of the whole PC?