I recently updated from core 190 to 197 and I have a weird problem.
I have a webserver in DMZ accepting connections (http/80) from multiple IoT sensors in GREEN. The sensors are sending “fast burst” of http connections every 15s or so.
This worked before (many years) but with the new core 197 I noticed that some of he connections are not happening anymore.
I did try to debug … looking for fw dropping connections, but I do not see any log.
I disabled also IPS … same thing.
I moved the server inside the GREEN network, and everything works again(!)
so something in the DMZ config must have changed, any help? what shuld I look for?
the logs in the system do not show any dropped pkts from the ipaddress of the sensors…
[EDIT] To clarify: I do get “some” connections, but not all of them. Out of a burst of 5 http request (POST) only 1 or 2 are arriving to the server in ORANGE. If I move to GREEN I see all of them, no loss.
If there are no dropped packets showing in the firewall logs then the next thing I would test is if you have a problem with the nics and they are3 dropping packets.
Run the following command
netstat -i
and it will show if there are any dropped packets occurring.
Hi, thanks for your suggestion, the setup has been running since 2018 (24/7) … I hardly believe that this is a problem of cabling since it is “in sync” with the release update. I suspect the clock modifications (running cool in summer ) are part of the problem
btw: any chance the “low clock thing” could be set as an option? asking because It seems to me quite relevant (unfortunately I’m trying to recover my root pass and I cannot test cpu governor for now … system is up from 7y … yeah … I know..)
Hi, so I was able to enter the system as root (pwd found!) and I forced the cpugovernor to “performance”. Clock is running on 2Ghz for all 4 cores now, and believe me or not .. no more issues. I’ve been testing for 30min now, but the difference is clear. I will test for today/tomorrow and eventually lower to “ondemand”, because from the CPU graph plot I can see the before core-197 my system clock was about 600/700Mhz in average … so maybe now is a bit too high
adding some more info: in my core-197 I do have cpupower but I do not see the other commands as documented in www.ipfire.org - cpupower . So something imho is pointing to this direction … either the update did not install everything, or the new command is not properly working on my cpu.
if I do “cpupower -c cpulist” I get an error “Error parsing cpu list”.
For the moment I set the cpugovernor to “ondemand” with a min freq of 900Mhz and it seems to work fine, I do not have the issues on dmz that I’ve see before (and if let the clock go down they show up again…)
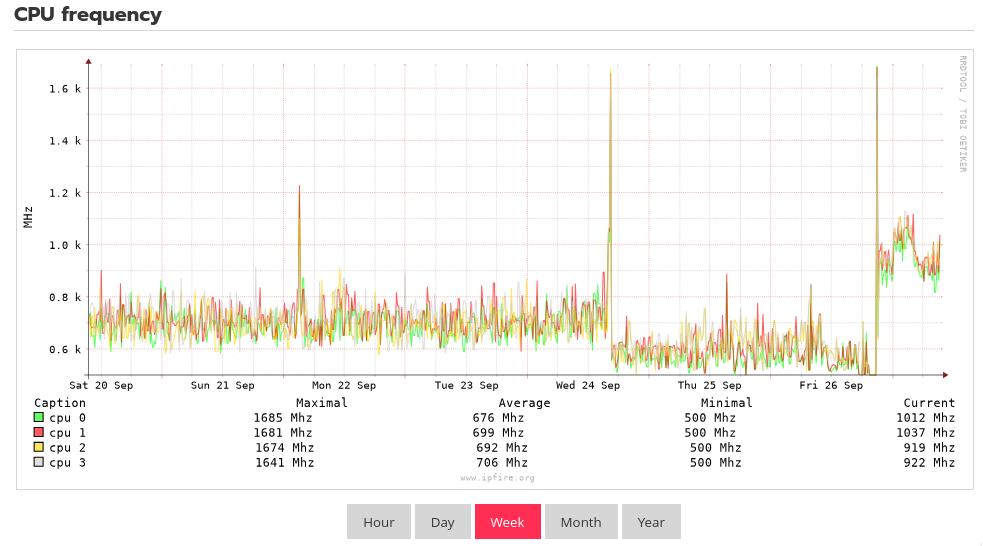
here is a pic of the clock before (core 190) /during (core 197) / after (core 197 + clock fix) the update. Maybe I can lower a bit more (in comparison to core 190) but for now temperature are just fine and I do not see issues.
My guess is that in my environment (home office, low traffic, FTTH) lowering the clock too much might affect those “rapid bursts” of http post from IoT sensors (4-5 requests every 15 s or so). The issue did not show up by placing the server in GREEN, but definitely it is happening with the server in ORANGE (this is how I found the problem…. missing data). Maybe the overall governor is too low by default, and the CPU does not get out of low_power mode fast enough to process all requests from GREEN (sensors) to ORANGE (server). Having said so …. I did not see pkt loss in netstat or drops in IPS/FW, just missing http calls to the server (and missing data in my log).
raising the clock fixed all issues for now… just for reference.
I mentioned that netstat did not show dropped pkts with lowered clock, but the server in orange is not getting the http call either. Sort of “missing in action” ahah. Raising the clock fixed all the problems, everything is solid as of today.