Thanks Leo for the quick response.
This is a solution, I think.
For fine tuning remain the size ( the graphs are a bit larger now ) and the colouring ( non-repeating colours for <= 20 data lines ).
Regards,
Bernhard
Thanks Leo for the quick response.
This is a solution, I think.
For fine tuning remain the size ( the graphs are a bit larger now ) and the colouring ( non-repeating colours for <= 20 data lines ).
Regards,
Bernhard
I’ve been experimenting (on & off) with trying to find perceivably different colors. Eight different colors is fairly easy. Twelve different colors is hard.
Twenty perceivably different colors feels impossible.
Disclaimer: I am not a graphics designer and have no expertise in this area!
Here are the current colors in the /srv/web/ipfire/html/themes/ipfire/include/colors.txt file on the IPFire device.
https://wiki.ipfire.org/devel/colors#existing
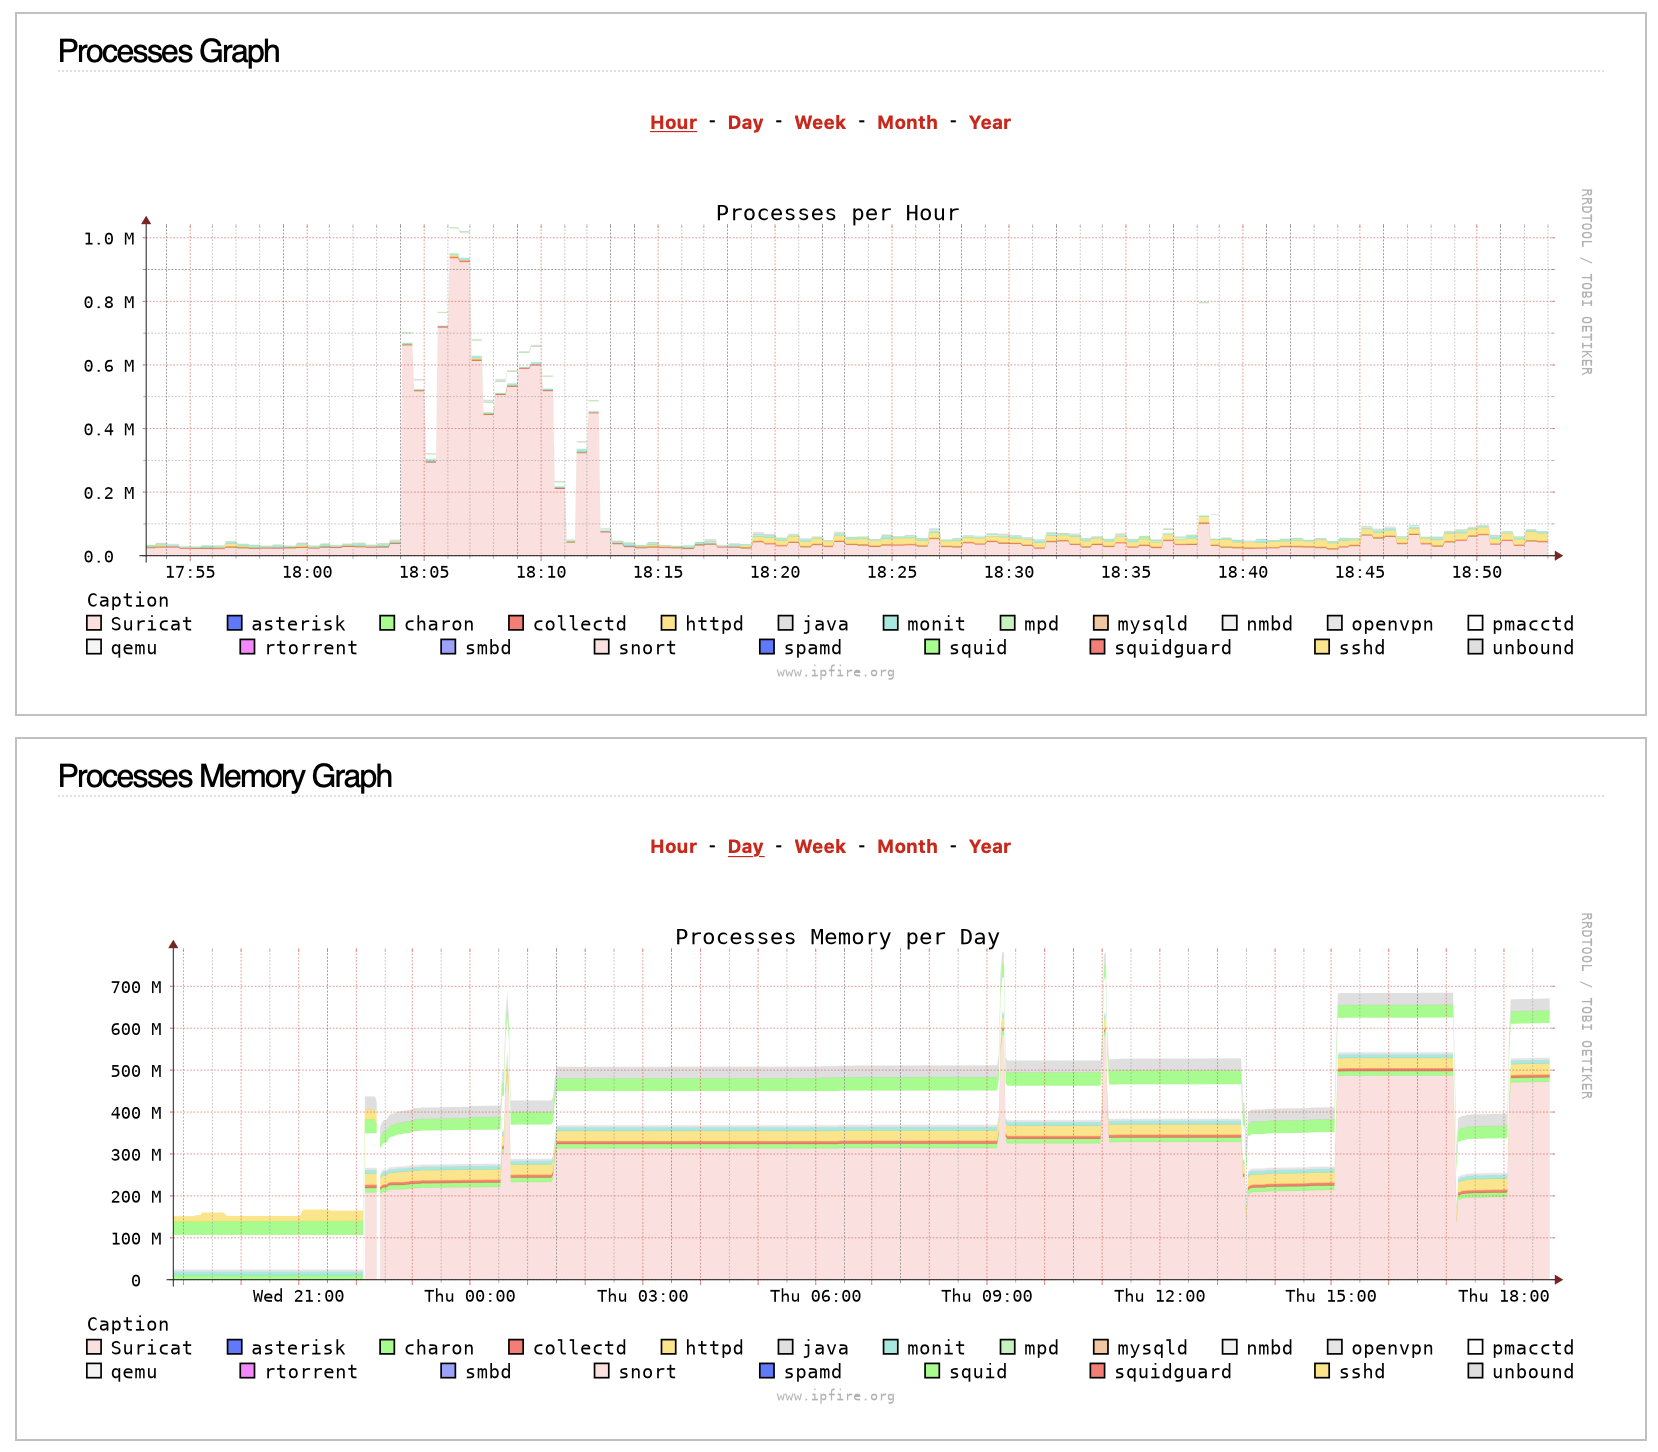
This is the existing colors with services.cgi page (not CPU Frequency):
This was my first attempt but the colors were two similar when stacked next to each other.
https://wiki.ipfire.org/devel/colors#possibility-1
This was my second attempt but some of the colors were just “ugh!”
https://wiki.ipfire.org/devel/colors#possibility-2
I’ve been experimenting with HSV (instead of RGB) and that may help…
Are there any graphics experts around?
I am not a graphics expert but I do remember from my Engineering career that line graphs should preferably have a single line but if they have to have multiple lines then no more than about 4 otherwise you just get a cluttered mess of lines with no ability to determine anything useful except if one of the lines is showing as a significant outlier.
I think if you have a line graph with 20 lines on it, there is no colour scheme that will be able to enable you to extract useful information from that data.
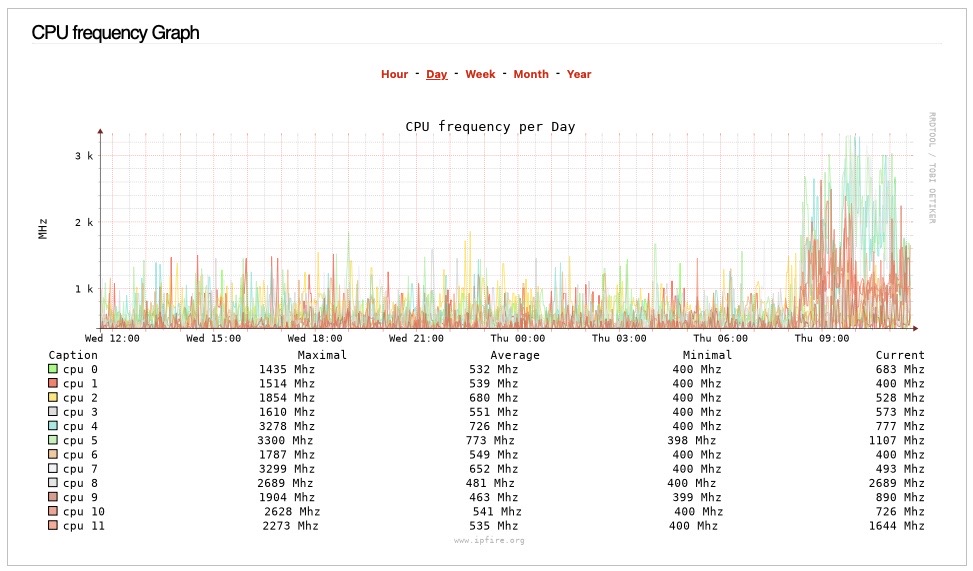
@jon , in your graph in post 13, with only 4 lines, you can just about see that cpu 0 is trending slightly lower than the other cores but you can get that information more easily from the average figures in the table below. However that difference in the average between the four cores is swamped by the delta between max and min frequency values so is it significant.
The question I would have is what action will anyone take from reviewing that graph.
If the graph showed one core running at 10MHz while the other three are at 1MHz then you might want to consider replacing the processor but based on the graph in post 13 I don’t gain any insight that I can usefully apply to how I configure or tune IPFire.
For my mini appliance I don’t even have any frequency graph and I don’t miss it in the least.
Agreed! As you said, unless there is something really wrong with the hardware there isn’t anything you can or should do about the clock speeds. A poor configuration choice might actually limit network performance and introduce latency issues.
I would suggest we make the graph reasonably usable but don’t invest a lot of work into splitting of more diagrams or something like that, because it’s mostly useless anyway.
OK, 'canvas_height' => 190 looks about right to me?
Without --full-size-mode the overall image dimensions may change slightly depending on the labeling.