CPU Freq Graph not working with i5-1235u

@deibit ,
the file is at /var/ipfire.
The findings in the article cited and in bugzilla are right.
The line
,"LINE1:cpu".$i.$color{"color1$j"}."A0:cpu ".$i." "
producing the error tries to build the string
LINE1:cpu<x><cy>A0:cpu<x>
with <x> being the cpu# and <cy> color<x+1+10>
Generating x+1+10 with '1<x+1>' only functions for out of 0…8 :frowning: , for x=9 you the string ‘110’, not ‘21’ ( = 9+1+10 )
The color names in colors.txt are ‘color1’ … ‘color25’, so the suggestion to use $color{$i}sholud be okay for all systems with 24 cpus maximal.

5 Likes

Yay!

I did change the string to

,"LINE1:cpu".$i.$color{"color$j"}."A0:cpu ".$i." "

as suggested, and now I can see all 12 CPUs!! (I am happy man)

I hope that @luani manages to fix this in the official version… this got me confused for some hours :slight_smile:

2 Likes

Maybe you could add a comment to that bug report, referencing this thread? I think it would be useful for the project.

2 Likes

Hi, thanks for the reminder!

Could you please try this patch because I don’t have a system with that many CPU cores:

diff --git a/config/cfgroot/graphs.pl b/config/cfgroot/graphs.pl
index 3368e5aad..1d93df361 100644
--- a/config/cfgroot/graphs.pl
+++ b/config/cfgroot/graphs.pl
@@ -1098,10 +1098,10 @@ sub updatecpufreqgraph {
 	);
 
 	for(my $i = 0; $i < $cpucount; $i++) {
-		my $j=$i+1;
+		my $j = ($i % 10) + 11;
 		push(@command,"DEF:cpu".$i."_=".$mainsettings{'RRDLOG'}."/collectd/localhost/cpufreq/cpufreq-".$i.".rrd:value:AVERAGE"
 				,"CDEF:cpu".$i."=cpu".$i."_,1000000,/"
-				,"LINE1:cpu".$i.$color{"color1$j"}."A0:cpu ".$i." "
+				,"LINE1:cpu".$i.$color{"color$j"}."A0:cpu ".$i." "
 				,"GPRINT:cpu".$i.":MAX:%3.0lf Mhz"
 				,"GPRINT:cpu".$i.":AVERAGE:%3.0lf Mhz"
 				,"GPRINT:cpu".$i.":MIN:%3.0lf Mhz"
--

This limits the color index to 11-20, starting at 12, ensuring that the colors on existing systems won’t be changed.

4 Likes

Only for completeness. This code produces the same colours for CPU0/CPU10, CPU1/CPU11, …
This aspect should be tested also. Are these graphs distinguishable enough? How is the size of the picture? Would it help to split into several graphs, one for 0 … 9, for 10…19, …?

2 Likes

This is the graph with @luani patch:

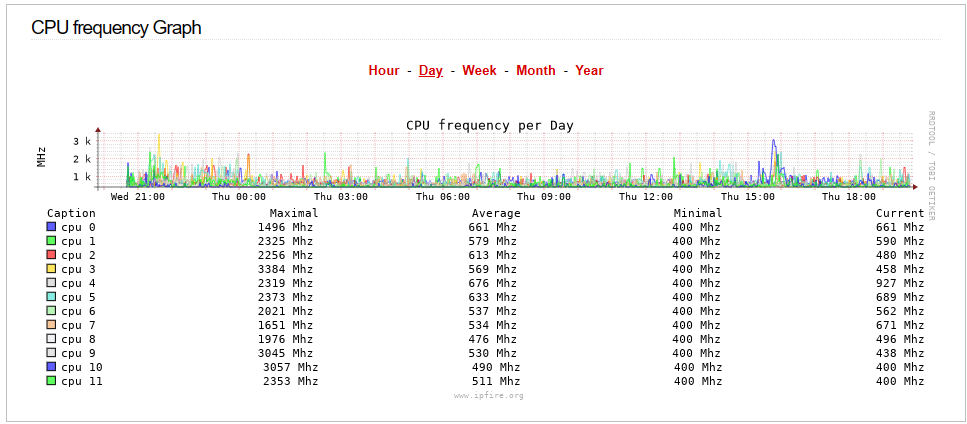
Yes, the colors cycle after cpu10

Graph is nice “to see”, but yes, @bbitsch has a point, it’s too “compressed” to be able to get something meaningful from it. Not sure is splitting is going to be the most optimum workaround… but I guess we don’t have more choices? (overlapping 12 colors in such a small space is always going to look like a colorful fuzzy nebula)

2 Likes

Yes unfortunately there aren’t many more usable colors available. Color21 is all white #FFFFFF.
I could make the index start at 12 and wrap around to 1. But looking at the screenshot I think the best option would be to increase the diagram height.

2 Likes

Keep in mind anything changed is temporary. An update will wipe out these changes.

The command to set the height is (with current value):

--height=300

So you may want to try 600.

I would try inserting it here (see height above COMMENTs):

sub updatecpufreqgraph {
	my $cpucount = `ls -dA $mainsettings{'RRDLOG'}/collectd/localhost/cpu-*/ 2>/dev/null | wc -l`;
	my $period    = $_[0];
	my @command = (
		@GRAPH_ARGS,
		"-",
		"--start",
		"-1".$period,
		"-r",
		"-t ".$Lang::tr{'cpu frequency per'}." ".$Lang::tr{$period."-graph"},
		"-v MHz",
		"--color=SHADEA".$color{"color19"},
		"--color=SHADEB".$color{"color19"},
		"--color=BACK".$color{"color21"},
		"--height=600",									# < - test here
		"COMMENT:".sprintf("%-10s",$Lang::tr{'caption'}),
		"COMMENT:".sprintf("%15s",$Lang::tr{'maximal'}),
		"COMMENT:".sprintf("%15s",$Lang::tr{'average'}),
		"COMMENT:".sprintf("%15s",$Lang::tr{'minimal'}),
		"COMMENT:".sprintf("%15s",$Lang::tr{'current'})."\\j"
	);

This has not been tested.


EDIT: Need to add an =. This should be:

--height=600

1 Like

I think it would make sense to maximize the colors up to the maximum possible… (being selfish, 12 sounds like a good number) :smiley:

for example hwtemp Graph in my installation shows 15 different colors for the 15 different sensors (even though the hwtemp graph is totally unreadable, is even smaller than the cpu one)

hwtemp graph uses a random color, generated by function random_hex_color.

Nice find!

It looks like a few graphs use this!

Interesting colors with random_hex_color!


Refresh to get new colors!

by the way @luani

If you look at the image I sent:

From cpu10, the Mhz information is not aligned with the previous ones

@deibit , @luani ,

changing the height to 200 ( was 300 ) and commenting out --full-size-mode, may lead to nicer pictures

Hi, here’s another attempt:

diff --git a/config/cfgroot/graphs.pl b/config/cfgroot/graphs.pl
index 3368e5aad..d6f529197 100644
--- a/config/cfgroot/graphs.pl
+++ b/config/cfgroot/graphs.pl
@@ -31,7 +31,9 @@ require "${General::swroot}/lang.pl";
 require "${General::swroot}/header.pl";
 
 # Graph image size in pixel
-our %image_size = ('width' => 910, 'height' => 300);
+# width/height: approximate size of final graph image, mainly used for placeholders
+# canvas width/height: size of the actual data area, without labeling
+our %image_size = ('width' => 900, 'height' => 300, 'canvas_width' => 800, 'canvas_height' => 200);
 
 # List of all available time ranges
 our @time_ranges = ("hour", "day", "week", "month", "year");
@@ -48,15 +50,12 @@ my @GRAPH_ARGS = (
 	# For a more 'organic' look
 	"--slope-mode",
 
-	# HxW define the size of the output image
-	"--full-size-mode",
-
 	# Watermark
 	"-W www.ipfire.org",
 
 	# Default size
-	"-w $image_size{'width'}",
-	"-h $image_size{'height'}",
+	"-w $image_size{'canvas_width'}",
+	"-h $image_size{'canvas_height'}",
 
 	# Use alternative grid
 	"--alt-y-grid",
@@ -1090,18 +1089,19 @@ sub updatecpufreqgraph {
 		"--color=SHADEA".$color{"color19"},
 		"--color=SHADEB".$color{"color19"},
 		"--color=BACK".$color{"color21"},
-		"COMMENT:".sprintf("%-10s",$Lang::tr{'caption'}),
+		"COMMENT:".sprintf("%-15s",$Lang::tr{'caption'}),
 		"COMMENT:".sprintf("%15s",$Lang::tr{'maximal'}),
 		"COMMENT:".sprintf("%15s",$Lang::tr{'average'}),
 		"COMMENT:".sprintf("%15s",$Lang::tr{'minimal'}),
 		"COMMENT:".sprintf("%15s",$Lang::tr{'current'})."\\j"
 	);
 
+	my $j = 11;
 	for(my $i = 0; $i < $cpucount; $i++) {
-		my $j=$i+1;
+		$j++; $j = 1 if $j > 20;
 		push(@command,"DEF:cpu".$i."_=".$mainsettings{'RRDLOG'}."/collectd/localhost/cpufreq/cpufreq-".$i.".rrd:value:AVERAGE"
 				,"CDEF:cpu".$i."=cpu".$i."_,1000000,/"
-				,"LINE1:cpu".$i.$color{"color1$j"}."A0:cpu ".$i." "
+				,"LINE1:cpu".$i.$color{"color$j"}."A0:cpu ".$i." "
 				,"GPRINT:cpu".$i.":MAX:%3.0lf Mhz"
 				,"GPRINT:cpu".$i.":AVERAGE:%3.0lf Mhz"
 				,"GPRINT:cpu".$i.":MIN:%3.0lf Mhz"
--
3 Likes

Thanks Leo for the quick response.

This is a solution, I think.
For fine tuning remain the size ( the graphs are a bit larger now ) and the colouring ( non-repeating colours for <= 20 data lines ).

Regards,
Bernhard

1 Like

I’ve been experimenting (on & off) with trying to find perceivably different colors. Eight different colors is fairly easy. Twelve different colors is hard.

Twenty perceivably different colors feels impossible.

Disclaimer: I am not a graphics designer and have no expertise in this area!

Existing

Here are the current colors in the /srv/web/ipfire/html/themes/ipfire/include/colors.txt file on the IPFire device.

https://wiki.ipfire.org/devel/colors#existing

This is the existing colors with services.cgi page (not CPU Frequency):

Possibility #1

This was my first attempt but the colors were two similar when stacked next to each other.

https://wiki.ipfire.org/devel/colors#possibility-1

Possibility #2

This was my second attempt but some of the colors were just “ugh!”

https://wiki.ipfire.org/devel/colors#possibility-2

I’ve been experimenting with HSV (instead of RGB) and that may help…

Are there any graphics experts around?

1 Like

I am not a graphics expert but I do remember from my Engineering career that line graphs should preferably have a single line but if they have to have multiple lines then no more than about 4 otherwise you just get a cluttered mess of lines with no ability to determine anything useful except if one of the lines is showing as a significant outlier.

I think if you have a line graph with 20 lines on it, there is no colour scheme that will be able to enable you to extract useful information from that data.

@jon , in your graph in post 13, with only 4 lines, you can just about see that cpu 0 is trending slightly lower than the other cores but you can get that information more easily from the average figures in the table below. However that difference in the average between the four cores is swamped by the delta between max and min frequency values so is it significant.
The question I would have is what action will anyone take from reviewing that graph.

If the graph showed one core running at 10MHz while the other three are at 1MHz then you might want to consider replacing the processor but based on the graph in post 13 I don’t gain any insight that I can usefully apply to how I configure or tune IPFire.

For my mini appliance I don’t even have any frequency graph and I don’t miss it in the least.

2 Likes

Agreed! As you said, unless there is something really wrong with the hardware there isn’t anything you can or should do about the clock speeds. A poor configuration choice might actually limit network performance and introduce latency issues.

I would suggest we make the graph reasonably usable but don’t invest a lot of work into splitting of more diagrams or something like that, because it’s mostly useless anyway.

OK, 'canvas_height' => 190 looks about right to me?

Without --full-size-mode the overall image dimensions may change slightly depending on the labeling.

4 Likes

By the way, I installed the new testing version, and so far so good

Thanks to everyone involved!

1 Like